Example Usage
Multiple output for single cell
#Displaying multiple output of a single cell
from IPython.core .interactiveshell import InteractiveShell
InteractiveShell.ast_node_interactivity = "all"
Importing Essential Libraries
import os
import pyiwr
import warnings
warnings .filterwarnings("ignore" , category=DeprecationWarning )
pyiwr is an advanced open -source library developed by researchers at the SIGMA Research Lab at IIT Indore.
This powerful tool is designed to effortlessly convert raw ISRO Doppler Weather Radar (DWR) data files and Restructure
dual-pol radar MOSDAC/corrected NetCDF files into Py-ART compatible NetCDF files . pyiwr also provides a range of useful
tools and visualization functions to facilitate working with and analyzing weather radar data.
“Data Source : MOSDAC/SAC/ISRO. https ://mosdac.gov.in ”
Dual - Polarized DWR FILES
“Data Source : MOSDAC/SAC/ISRO. https://mosdac.gov.in”
Defining File Path
import os
file_path = 'D:\\test_data\\dwr'
file_list = os .listdir(file_path)
file_list
['RCTLS_30NOV2017_025502_L2B_STD.nc ',
'RCTLS_30NOV2017_061521_L2B_STD.nc ',
'RSCHR_11JUL2019_023140_L2B_STD.nc ',
'RSCHR_24MAR2022_004350_L2B_STD.nc ',
'RSSHR_11JUL2019_193241_L2B_STD.nc ',
'RSSHR_11JUL2019_195339_L2B_STD.nc ']
filenamel1 = os.path.join(file_path, file_list[6 ])
filenamel2 = os.path.join(file_path, file_list[7 ])
filenamel3 = os.path.join(file_path, file_list[2 ])
filenamel4 = os.path.join(file_path, file_list[3 ])
filenamel5 = os.path.join(file_path, file_list[4 ])
filenamel6 = os.path.join(file_path, file_list[5 ])
TERLS RADAR
Reading content of file and making radar object
radar = pyiwr.format_transform .correctednc (filenamel4, save_file=False)
radar.info()
Processing file: RCTLS_30NOV2017_061521_L2B_STD.nc
Date Time of Mosdac File RCTLS_30NOV2017_061521_L2B_STD.nc corrected successfully
altitude:
data: <ndarray of type: float64 and shape: (1 ,)>
_FillValue: nan
units: meters
altitude_agl: None
antenna_transition: None
azimuth:
data: <ndarray of type: float32 and shape: (3960 ,)>
_FillValue: nan
standard_name: ray_azimuth_angle
units: degrees
long_name: azimuth_angle_from_true_north
axis: radial_azimuth_coordinate
elevation:
data: <ndarray of type: float32 and shape: (3960 ,)>
_FillValue: nan
standard_name: ray_elevation_angle
units: degrees
long_name: elevation_angle_from_horizontal_plane
axis: radial_azimuth_coordinate
fields:
DBZ:
data: <ndarray of type: float32 and shape: (3960 , 1600 )>
_FillValue: 0.0
units: dBZ
standard_name: equivalent_reflectivity_factor
Polarization: Horizontal
coordinates: time range
VEL:
data: <ndarray of type: float32 and shape: (3960 , 1600 )>
_FillValue: 0.0
units: m/s
standard_name: radial_velocity_of_scatterers_ away_from_instrument
Polarization: Horizontal
coordinates: time range
WIDTH:
data: <ndarray of type: float32 and shape: (3960 , 1600 )>
_FillValue: 0.0
units: m/s
standard_name: doppler_spectrum_width
Polarization: Horizontal
coordinates: time range
ZDR:
data: <ndarray of type: float32 and shape: (3960 , 1600 )>
_FillValue: 0.0
units: dB
standard_name: log_differential_reflectivity_hv
Polarization: Horizontal and Vertical
coordinates: time range
PHIDP:
data: <ndarray of type: float32 and shape: (3960 , 1600 )>
_FillValue: 0.0
units: degrees
standard_name: differential_phase_hv
Polarization: Horizontal and Vertical
coordinates: time range
RHOHV:
data: <ndarray of type: float32 and shape: (3960 , 1600 )>
_FillValue: 0.0
units:
standard_name: cross_correlation_ratio_hv
Polarization: Horizontal and Vertical
coordinates: time range
fixed_angle:
data: <ndarray of type: float32 and shape: (11 ,)>
_FillValue: nan
units: degrees
instrument_parameters: None
latitude:
data: <ndarray of type: float64 and shape: (1 ,)>
_FillValue: nan
units: degrees_north
longitude:
data: <ndarray of type: float64 and shape: (1 ,)>
_FillValue: nan
units: degrees_east
nsweeps: 11
ngates: 1600
nrays: 3960
radar_calibration: None
range:
data: <ndarray of type: float64 and shape: (1600 ,)>
_FillValue: nan
standard_name: projection_range_coordinate
long_name: range_to_measurement_volume
units: meters
spacing_is_constant: true
meters_to_center_of_first_gate: true
axis: radial_range_coordinate
scan_rate: None
scan_type: ppi
sweep_end_ray_index:
data: <ndarray of type: int64 and shape: (11 ,)>
sweep_mode:
data: <ndarray of type: |S1 and shape: (11 , 32 )>
sweep_number:
data: <ndarray of type: int32 and shape: (11 ,)>
sweep_start_ray_index:
data: <ndarray of type: int64 and shape: (11 ,)>
target_scan_rate: None
time:
data: <ndarray of type: float64 and shape: (3960 ,)>
_FillValue: nan
standard_name: time
long_name: time_in_seconds_since_volume_start
units: seconds since 2017 -11 -30 T06:15 :21
calendar: gregorian
metadata:
instrument_name: TERLS C-band Dual-pol DWR
Created using: pyiwr (Indian Weather Radar) Module developed by Researchers at SIGMA Research Lab, IIT Indore
version: Version 1.0
title: TERLS C-band DWR data
institution: ISRO
references: Py-art_https://arm-doe.github.io/pyart/notebooks/basic_ingest_using_test_radar_object.html
source: DWR volume scan data
comment:
Conventions: CF/Radial
field_names: DBZ, VEL, WIDTH, ZDR, PHIDP, RHOHV
history: DWR mosdac files (.nc) data encoded into Py-ART compatible NetCDF file
volume_number: 0
platform_type: fixed
instrument_type: radar
primary_axis: axis_z
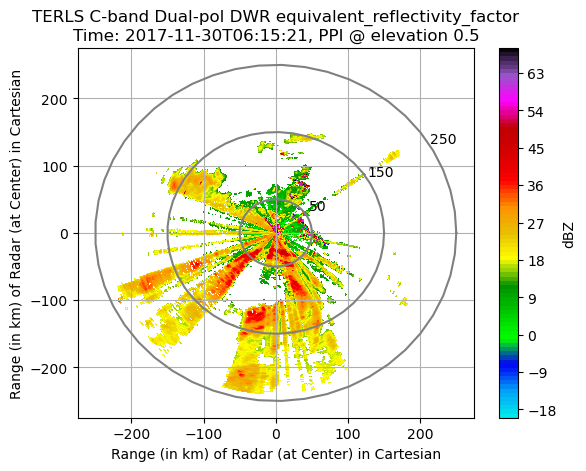
Visualization in Cartesian Plane
PPI Plot of any Radar Field at any given elevation angle
pyiwr.visualize.elevation(radar, field_name='DBZ', elevation_index=0, rings=True, grid=True,
                                                  range_in_km=True, save_image=False, img_name='terls_dbz0.png')
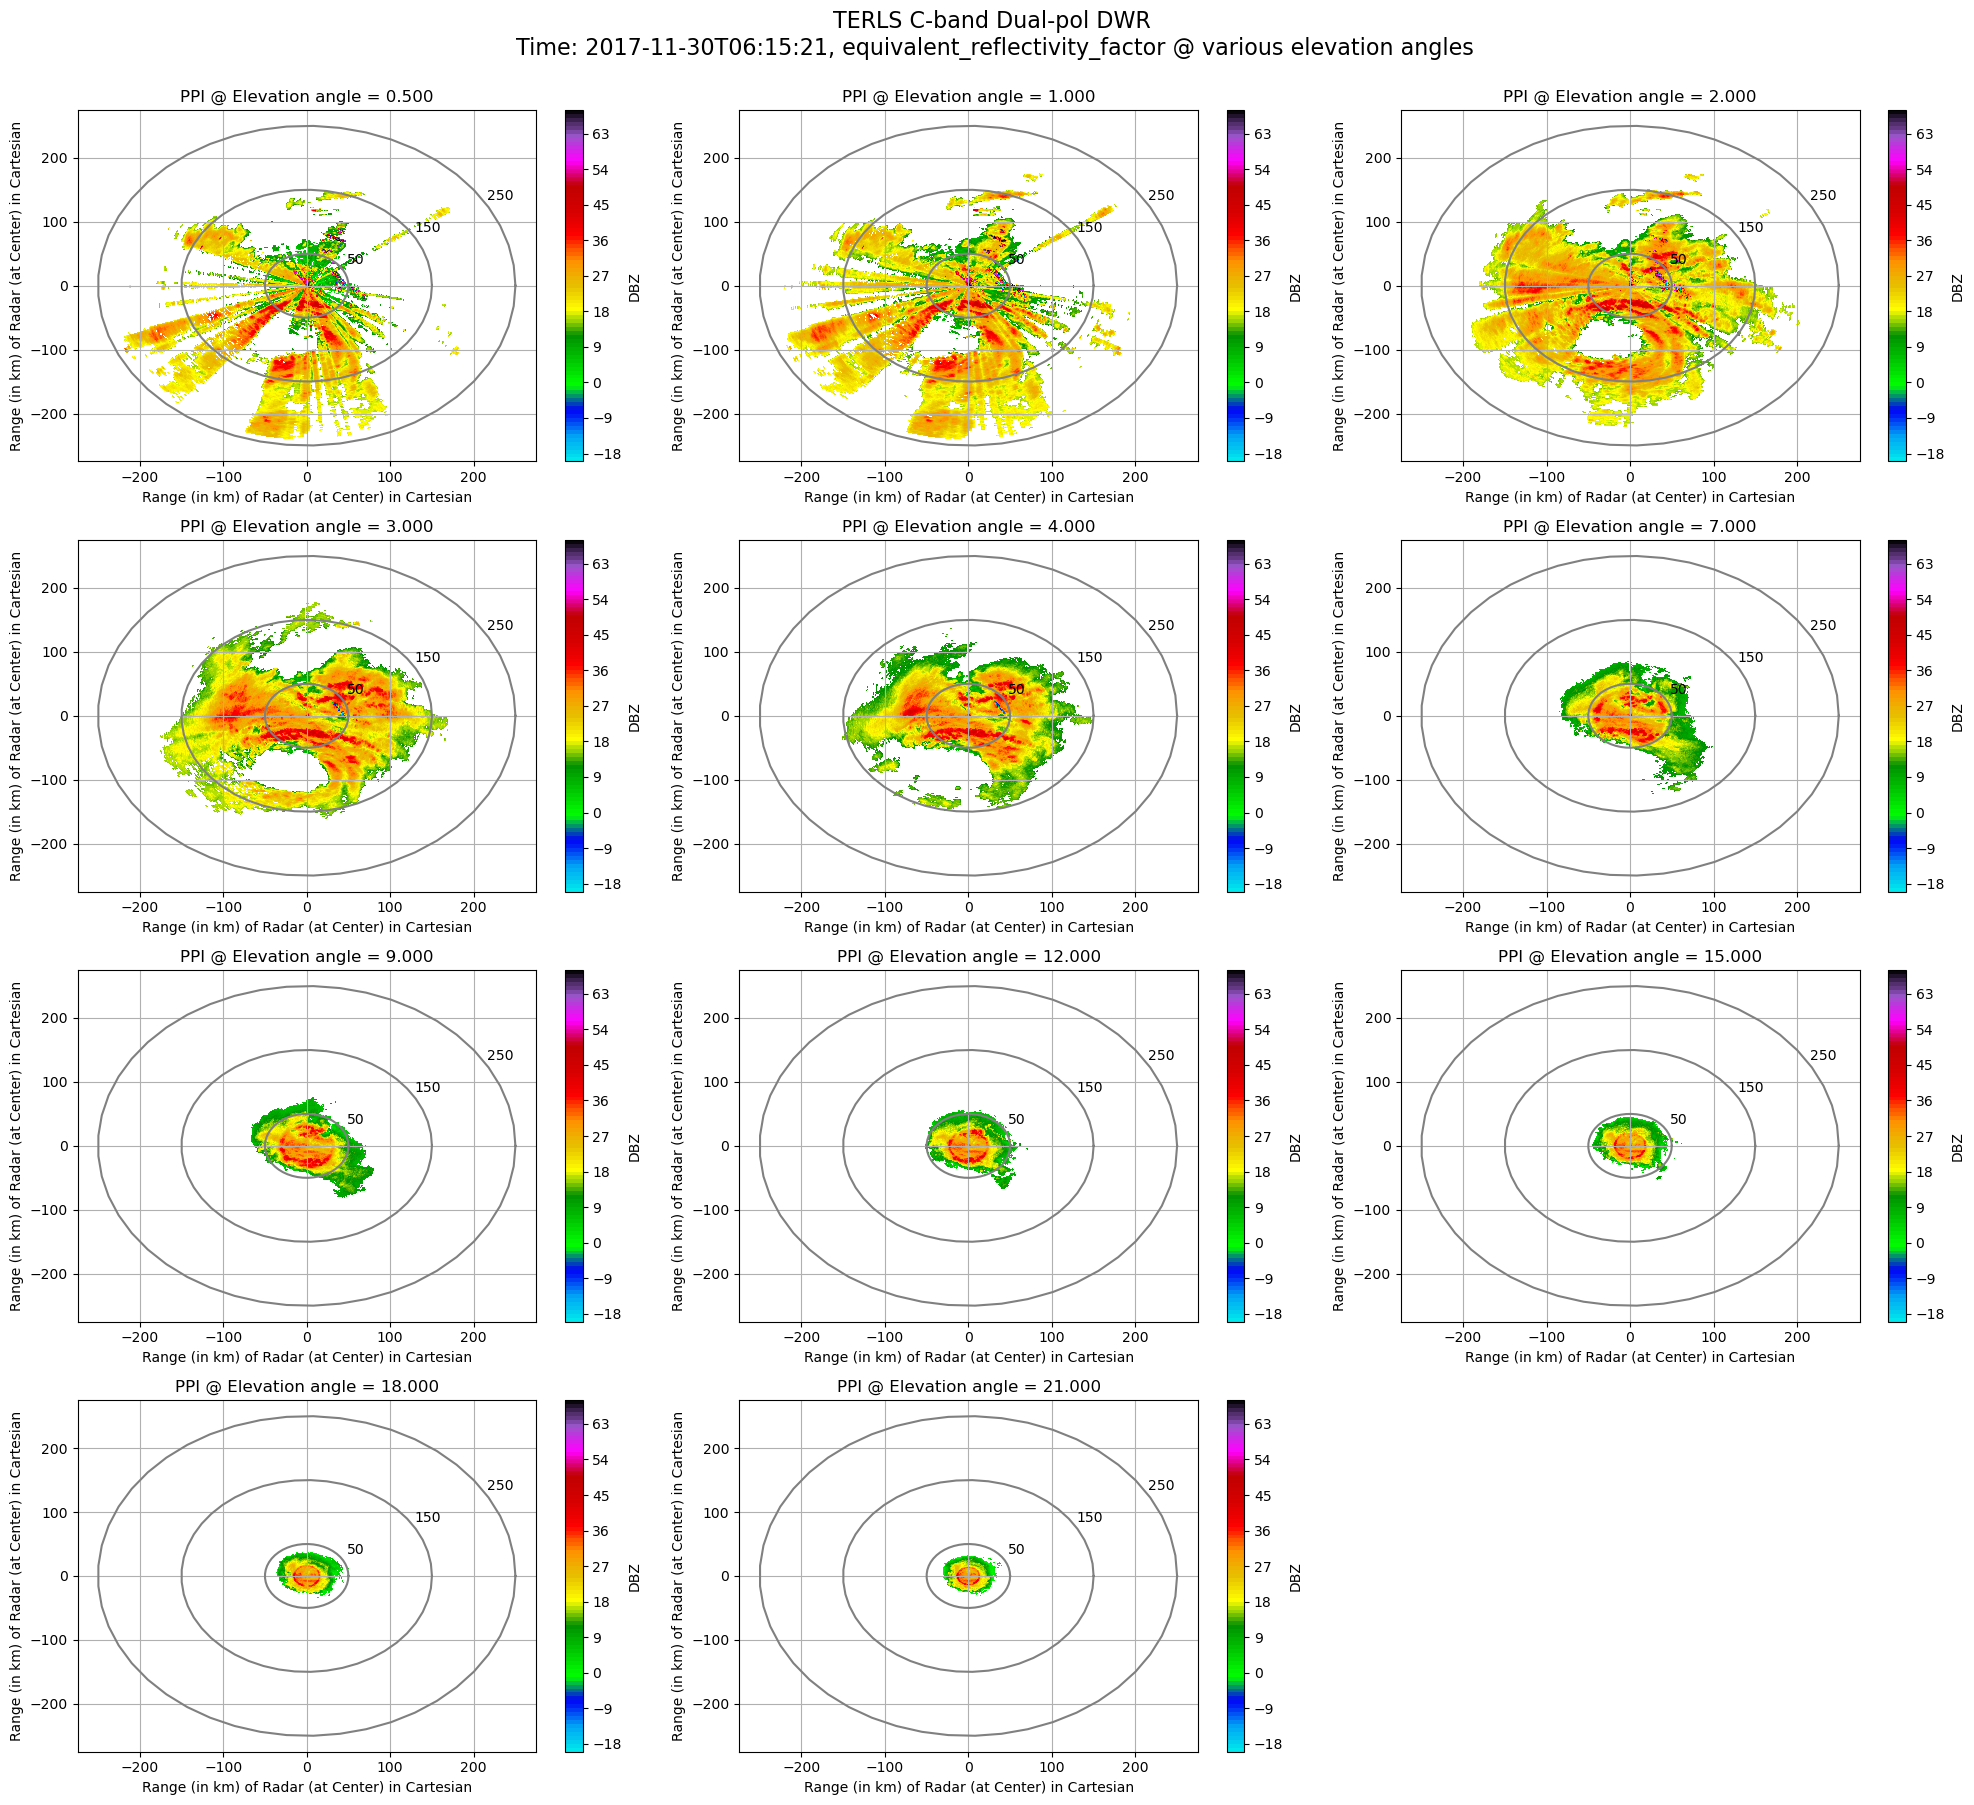
PPI Plots at all elevation angle of any Radar Field
pyiwr.visualize.all_elevation(radar, field_name='DBZ ', rings=True , grid=True , range_in_km=True ,
save_image=False , img_name='terls_dbzall.png ')
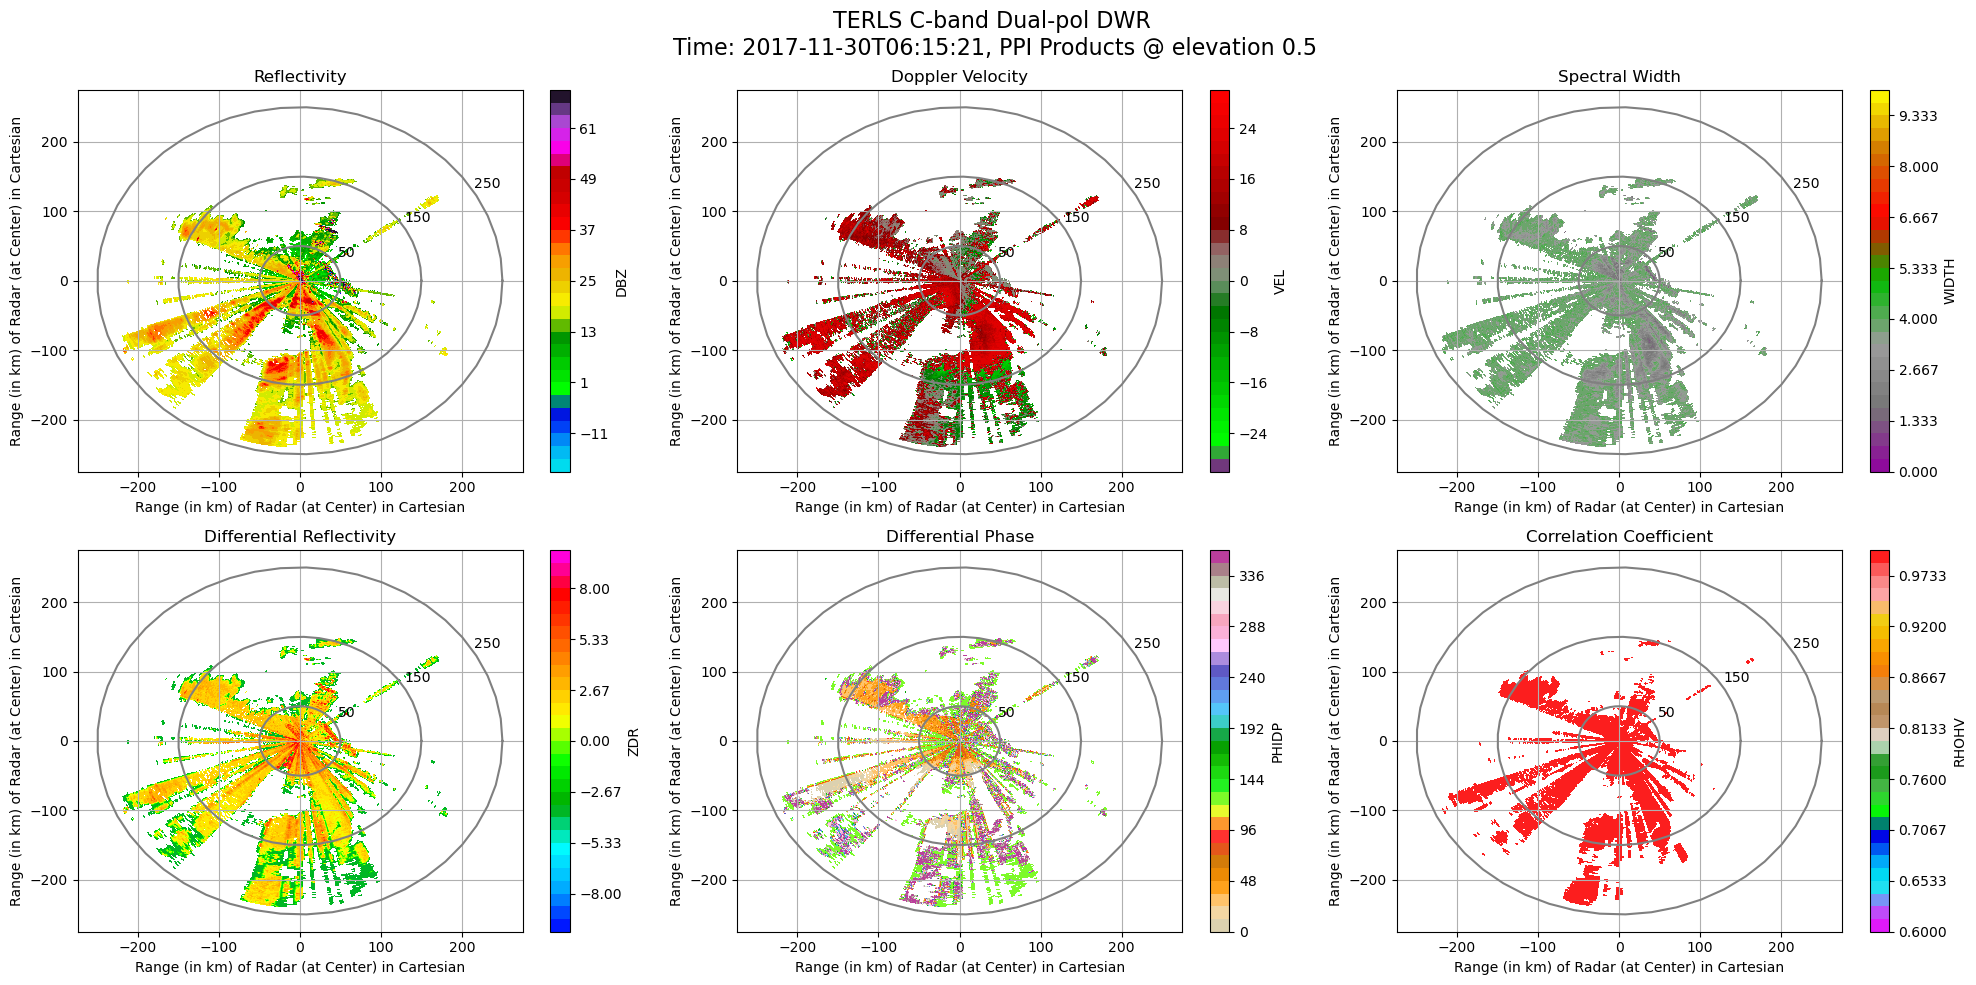
PPI Plots of all Radar Fields at any given elevation angle
pyiwr.visualize.fields_elevation(radar, elevation_index=0, range_in_km=True, rings=True, grid=True,
                                                  save_image=False, img_name='terls_fieldall.png')
Reading content of file and making grid object
xg = pyiwr.format_transform.sweeps2gridnc(filenamel4, grid_shape=(81 , 501 , 501 ), height=20 , length=250 ,
save_file=False)
xg
Processing file : RCTLS_30NOV2017_061521_L2B_STD.nc
Xarray gridding of volumetric sweeps of radar PPI scan file : RCTLS_30NOV2017_061521_L2B_STD.nc done successfully
<xarray.Dataset>
Dimensions:  (time: 1, z: 81, y: 501, x: 501)
Coordinates:
   time     (time) object 2017-11-30 06:15:21.055556
   z        (z) float64 0.0 250.0 500.0 750.0 ... 1.95e+04 1.975e+04 2e+04
    lat      (y) float64 6.283 6.292 6.301 6.31 ... 10.75 10.76 10.77 10.78
    lon      (x) float64 74.6 74.61 74.62 74.63 74.64 ... 79.1 79.11 79.12 79.13
   y        (y) float64 -2.5e+05 -2.49e+05 -2.48e+05 ... 2.49e+05 2.5e+05
  * x        (x) float64 -2.5e+05 -2.49e+05 -2.48e+05 ... 2.49e+05 2.5e+05
Data variables:
    DBZ      (time, z, y, x) float32 nan nan nan nan nan ... nan nan nan nan nan
    VEL      (time, z, y, x) float32 nan nan nan nan nan ... nan nan nan nan nan
    WIDTH    (time, z, y, x) float32 nan nan nan nan nan ... nan nan nan nan nan
    ZDR      (time, z, y, x) float32 nan nan nan nan nan ... nan nan nan nan nan
    PHIDP    (time, z, y, x) float32 nan nan nan nan nan ... nan nan nan nan nan
    RHOHV    (time, z, y, x) float32 nan nan nan nan nan ... nan nan nan nan nan
ROI (time, z, y, x) float32 9.258e+03 9.24e+03 ... 1.024e+04 1.026e+04 Dimensions:
Coordinates: (6)
time
(time)
object
2017-11-30 06:15:21.055556
array([cftime.DatetimeGregorian(2017, 11, 30, 6, 15, 21, 55556, has_year_zero=False)],
      dtype=object)
z
(z)
float64
0.0 250.0 500.0 ... 1.975e+04 2e+04
standard_name : projection_z_coordinate long_name : Z distance on the projection plane from the origin axis : Z units : m positive : up array([ 0., 250., 500., 750., 1000., 1250., 1500., 1750., 2000.,
2250., 2500., 2750., 3000., 3250., 3500., 3750., 4000., 4250.,
4500., 4750., 5000., 5250., 5500., 5750., 6000., 6250., 6500.,
6750., 7000., 7250., 7500., 7750., 8000., 8250., 8500., 8750.,
9000., 9250., 9500., 9750., 10000., 10250., 10500., 10750., 11000.,
11250., 11500., 11750., 12000., 12250., 12500., 12750., 13000., 13250.,
13500., 13750., 14000., 14250., 14500., 14750., 15000., 15250., 15500.,
15750., 16000., 16250., 16500., 16750., 17000., 17250., 17500., 17750.,
18000., 18250., 18500., 18750., 19000., 19250., 19500., 19750., 20000.]) lat
(y)
float64
6.283 6.292 6.301 ... 10.77 10.78
long_name : latitude of grid cell center units : degree_N standard_name : Latitude array([ 6.28308311, 6.29207391, 6.30106472, 6.31005553, 6.31904634,
6.32803714, 6.33702795, 6.34601876, 6.35500956, 6.36400037,
6.37299117, 6.38198198, 6.39097279, 6.39996359, 6.4089544 ,
6.4179452 , 6.42693601, 6.43592681, 6.44491762, 6.45390842,
6.46289923, 6.47189003, 6.48088083, 6.48987164, 6.49886244,
6.50785324, 6.51684405, 6.52583485, 6.53482565, 6.54381646,
6.55280726, 6.56179806, 6.57078886, 6.57977966, 6.58877046,
6.59776127, 6.60675207, 6.61574287, 6.62473367, 6.63372447,
6.64271527, 6.65170607, 6.66069687, 6.66968767, 6.67867847,
6.68766927, 6.69666007, 6.70565087, 6.71464167, 6.72363247,
6.73262326, 6.74161406, 6.75060486, 6.75959566, 6.76858646,
6.77757725, 6.78656805, 6.79555885, 6.80454964, 6.81354044,
6.82253124, 6.83152203, 6.84051283, 6.84950363, 6.85849442,
6.86748522, 6.87647601, 6.88546681, 6.8944576 , 6.9034484 ,
6.91243919, 6.92142999, 6.93042078, 6.93941158, 6.94840237,
6.95739316, 6.96638396, 6.97537475, 6.98436554, 6.99335634,
7.00234713, 7.01133792, 7.02032871, 7.0293195 , 7.0383103 ,
7.04730109, 7.05629188, 7.06528267, 7.07427346, 7.08326425,
7.09225504, 7.10124583, 7.11023662, 7.11922741, 7.1282182 ,
7.13720899, 7.14619978, 7.15519057, 7.16418136, 7.17317215,
...
9.92434334, 9.93333406, 9.94232478, 9.9513155 , 9.96030622,
9.96929694, 9.97828765, 9.98727837, 9.99626909, 10.00525981,
10.01425053, 10.02324124, 10.03223196, 10.04122268, 10.05021339,
10.05920411, 10.06819482, 10.07718554, 10.08617626, 10.09516697,
10.10415769, 10.1131484 , 10.12213912, 10.13112983, 10.14012054,
10.14911126, 10.15810197, 10.16709268, 10.1760834 , 10.18507411,
10.19406482, 10.20305553, 10.21204625, 10.22103696, 10.23002767,
10.23901838, 10.24800909, 10.2569998 , 10.26599051, 10.27498122,
10.28397193, 10.29296264, 10.30195335, 10.31094406, 10.31993477,
10.32892548, 10.33791618, 10.34690689, 10.3558976 , 10.36488831,
10.37387901, 10.38286972, 10.39186043, 10.40085113, 10.40984184,
10.41883255, 10.42782325, 10.43681396, 10.44580466, 10.45479537,
10.46378607, 10.47277678, 10.48176748, 10.49075819, 10.49974889,
10.50873959, 10.5177303 , 10.526721 , 10.5357117 , 10.5447024 ,
10.5536931 , 10.56268381, 10.57167451, 10.58066521, 10.58965591,
10.59864661, 10.60763731, 10.61662801, 10.62561871, 10.63460941,
10.64360011, 10.65259081, 10.66158151, 10.67057221, 10.67956291,
10.6885536 , 10.6975443 , 10.706535 , 10.7155257 , 10.72451639,
10.73350709, 10.74249779, 10.75148848, 10.76047918, 10.76946987,
10.77846057]) lon
(x)
float64
74.6 74.61 74.62 ... 79.12 79.13
long_name : longitude of grid cell center units : degree_E standard_name : Longitude array([74.6043822 , 74.61342732, 74.62247244, 74.63151756, 74.64056268,
74.64960781, 74.65865293, 74.66769806, 74.67674319, 74.68578832,
74.69483345, 74.70387859, 74.71292372, 74.72196886, 74.731014 ,
74.74005914, 74.74910429, 74.75814943, 74.76719458, 74.77623973,
74.78528488, 74.79433003, 74.80337519, 74.81242034, 74.8214655 ,
74.83051066, 74.83955582, 74.84860098, 74.85764614, 74.86669131,
74.87573648, 74.88478165, 74.89382682, 74.90287199, 74.91191716,
74.92096234, 74.93000752, 74.9390527 , 74.94809788, 74.95714306,
74.96618824, 74.97523343, 74.98427861, 74.9933238 , 75.00236899,
75.01141418, 75.02045937, 75.02950457, 75.03854976, 75.04759496,
75.05664016, 75.06568536, 75.07473056, 75.08377577, 75.09282097,
75.10186618, 75.11091138, 75.11995659, 75.1290018 , 75.13804702,
75.14709223, 75.15613744, 75.16518266, 75.17422788, 75.1832731 ,
75.19231832, 75.20136354, 75.21040876, 75.21945399, 75.22849921,
75.23754444, 75.24658967, 75.2556349 , 75.26468013, 75.27372536,
75.2827706 , 75.29181583, 75.30086107, 75.30990631, 75.31895155,
75.32799679, 75.33704203, 75.34608727, 75.35513252, 75.36417776,
75.37322301, 75.38226826, 75.3913135 , 75.40035875, 75.40940401,
75.41844926, 75.42749451, 75.43653977, 75.44558502, 75.45463028,
75.46367554, 75.4727208 , 75.48176606, 75.49081132, 75.49985659,
...
78.26772446, 78.27676972, 78.28581498, 78.29486023, 78.30390549,
78.31295074, 78.32199599, 78.33104125, 78.3400865 , 78.34913174,
78.35817699, 78.36722224, 78.37626748, 78.38531273, 78.39435797,
78.40340321, 78.41244845, 78.42149369, 78.43053893, 78.43958417,
78.4486294 , 78.45767464, 78.46671987, 78.4757651 , 78.48481033,
78.49385556, 78.50290079, 78.51194601, 78.52099124, 78.53003646,
78.53908168, 78.5481269 , 78.55717212, 78.56621734, 78.57526256,
78.58430777, 78.59335298, 78.6023982 , 78.61144341, 78.62048862,
78.62953382, 78.63857903, 78.64762423, 78.65666944, 78.66571464,
78.67475984, 78.68380504, 78.69285024, 78.70189543, 78.71094063,
78.71998582, 78.72903101, 78.7380762 , 78.74712139, 78.75616657,
78.76521176, 78.77425694, 78.78330212, 78.7923473 , 78.80139248,
78.81043766, 78.81948284, 78.82852801, 78.83757318, 78.84661835,
78.85566352, 78.86470869, 78.87375386, 78.88279902, 78.89184418,
78.90088934, 78.9099345 , 78.91897966, 78.92802481, 78.93706997,
78.94611512, 78.95516027, 78.96420542, 78.97325057, 78.98229571,
78.99134086, 79.000386 , 79.00943114, 79.01847628, 79.02752141,
79.03656655, 79.04561168, 79.05465681, 79.06370194, 79.07274707,
79.08179219, 79.09083732, 79.09988244, 79.10892756, 79.11797268,
79.1270178 ]) y
(y)
float64
-2.5e+05 -2.49e+05 ... 2.5e+05
standard_name : projection_y_coordinate long_name : Y distance on the projection plane from the origin axis : Y units : m array([-250000., -249000., -248000., ..., 248000., 249000., 250000.]) x
(x)
float64
-2.5e+05 -2.49e+05 ... 2.5e+05
standard_name : projection_x_coordinate long_name : X distance on the projection plane from the origin axis : X units : m array([-250000., -249000., -248000., ..., 248000., 249000., 250000.]) Data variables: (7)
DBZ
(time, z, y, x)
float32
nan nan nan nan ... nan nan nan nan
_FillValue : 0.0 units : dBZ standard_name : equivalent_reflectivity_factor Polarization : Horizontal coordinates : time range array([[[[nan, nan, nan, ..., nan, nan, nan],
[nan, nan, nan, ..., nan, nan, nan],
[nan, nan, nan, ..., nan, nan, nan],
...,
[nan, nan, nan, ..., nan, nan, nan],
[nan, nan, nan, ..., nan, nan, nan],
[nan, nan, nan, ..., nan, nan, nan]],
[[nan, nan, nan, ..., nan, nan, nan],
[nan, nan, nan, ..., nan, nan, nan],
[nan, nan, nan, ..., nan, nan, nan],
...,
[nan, nan, nan, ..., nan, nan, nan],
[nan, nan, nan, ..., nan, nan, nan],
[nan, nan, nan, ..., nan, nan, nan]],
[[nan, nan, nan, ..., nan, nan, nan],
[nan, nan, nan, ..., nan, nan, nan],
[nan, nan, nan, ..., nan, nan, nan],
...,
...
...,
[nan, nan, nan, ..., nan, nan, nan],
[nan, nan, nan, ..., nan, nan, nan],
[nan, nan, nan, ..., nan, nan, nan]],
[[nan, nan, nan, ..., nan, nan, nan],
[nan, nan, nan, ..., nan, nan, nan],
[nan, nan, nan, ..., nan, nan, nan],
...,
[nan, nan, nan, ..., nan, nan, nan],
[nan, nan, nan, ..., nan, nan, nan],
[nan, nan, nan, ..., nan, nan, nan]],
[[nan, nan, nan, ..., nan, nan, nan],
[nan, nan, nan, ..., nan, nan, nan],
[nan, nan, nan, ..., nan, nan, nan],
...,
[nan, nan, nan, ..., nan, nan, nan],
[nan, nan, nan, ..., nan, nan, nan],
[nan, nan, nan, ..., nan, nan, nan]]]], dtype=float32) VEL
(time, z, y, x)
float32
nan nan nan nan ... nan nan nan nan
_FillValue : 0.0 units : m/s standard_name : radial_velocity_ofscatterers away_from_instrument Polarization : Horizontal coordinates : time range array([[[[nan, nan, nan, ..., nan, nan, nan],
[nan, nan, nan, ..., nan, nan, nan],
[nan, nan, nan, ..., nan, nan, nan],
...,
[nan, nan, nan, ..., nan, nan, nan],
[nan, nan, nan, ..., nan, nan, nan],
[nan, nan, nan, ..., nan, nan, nan]],
[[nan, nan, nan, ..., nan, nan, nan],
[nan, nan, nan, ..., nan, nan, nan],
[nan, nan, nan, ..., nan, nan, nan],
...,
[nan, nan, nan, ..., nan, nan, nan],
[nan, nan, nan, ..., nan, nan, nan],
[nan, nan, nan, ..., nan, nan, nan]],
[[nan, nan, nan, ..., nan, nan, nan],
[nan, nan, nan, ..., nan, nan, nan],
[nan, nan, nan, ..., nan, nan, nan],
...,
...
...,
[nan, nan, nan, ..., nan, nan, nan],
[nan, nan, nan, ..., nan, nan, nan],
[nan, nan, nan, ..., nan, nan, nan]],
[[nan, nan, nan, ..., nan, nan, nan],
[nan, nan, nan, ..., nan, nan, nan],
[nan, nan, nan, ..., nan, nan, nan],
...,
[nan, nan, nan, ..., nan, nan, nan],
[nan, nan, nan, ..., nan, nan, nan],
[nan, nan, nan, ..., nan, nan, nan]],
[[nan, nan, nan, ..., nan, nan, nan],
[nan, nan, nan, ..., nan, nan, nan],
[nan, nan, nan, ..., nan, nan, nan],
...,
[nan, nan, nan, ..., nan, nan, nan],
[nan, nan, nan, ..., nan, nan, nan],
[nan, nan, nan, ..., nan, nan, nan]]]], dtype=float32) WIDTH
(time, z, y, x)
float32
nan nan nan nan ... nan nan nan nan
_FillValue : 0.0 units : m/s standard_name : doppler_spectrum_width Polarization : Horizontal coordinates : time range array([[[[nan, nan, nan, ..., nan, nan, nan],
[nan, nan, nan, ..., nan, nan, nan],
[nan, nan, nan, ..., nan, nan, nan],
...,
[nan, nan, nan, ..., nan, nan, nan],
[nan, nan, nan, ..., nan, nan, nan],
[nan, nan, nan, ..., nan, nan, nan]],
[[nan, nan, nan, ..., nan, nan, nan],
[nan, nan, nan, ..., nan, nan, nan],
[nan, nan, nan, ..., nan, nan, nan],
...,
[nan, nan, nan, ..., nan, nan, nan],
[nan, nan, nan, ..., nan, nan, nan],
[nan, nan, nan, ..., nan, nan, nan]],
[[nan, nan, nan, ..., nan, nan, nan],
[nan, nan, nan, ..., nan, nan, nan],
[nan, nan, nan, ..., nan, nan, nan],
...,
...
...,
[nan, nan, nan, ..., nan, nan, nan],
[nan, nan, nan, ..., nan, nan, nan],
[nan, nan, nan, ..., nan, nan, nan]],
[[nan, nan, nan, ..., nan, nan, nan],
[nan, nan, nan, ..., nan, nan, nan],
[nan, nan, nan, ..., nan, nan, nan],
...,
[nan, nan, nan, ..., nan, nan, nan],
[nan, nan, nan, ..., nan, nan, nan],
[nan, nan, nan, ..., nan, nan, nan]],
[[nan, nan, nan, ..., nan, nan, nan],
[nan, nan, nan, ..., nan, nan, nan],
[nan, nan, nan, ..., nan, nan, nan],
...,
[nan, nan, nan, ..., nan, nan, nan],
[nan, nan, nan, ..., nan, nan, nan],
[nan, nan, nan, ..., nan, nan, nan]]]], dtype=float32) ZDR
(time, z, y, x)
float32
nan nan nan nan ... nan nan nan nan
_FillValue : 0.0 units : dB standard_name : log_differential_reflectivity_hv Polarization : Horizontal and Vertical coordinates : time range array([[[[nan, nan, nan, ..., nan, nan, nan],
[nan, nan, nan, ..., nan, nan, nan],
[nan, nan, nan, ..., nan, nan, nan],
...,
[nan, nan, nan, ..., nan, nan, nan],
[nan, nan, nan, ..., nan, nan, nan],
[nan, nan, nan, ..., nan, nan, nan]],
[[nan, nan, nan, ..., nan, nan, nan],
[nan, nan, nan, ..., nan, nan, nan],
[nan, nan, nan, ..., nan, nan, nan],
...,
[nan, nan, nan, ..., nan, nan, nan],
[nan, nan, nan, ..., nan, nan, nan],
[nan, nan, nan, ..., nan, nan, nan]],
[[nan, nan, nan, ..., nan, nan, nan],
[nan, nan, nan, ..., nan, nan, nan],
[nan, nan, nan, ..., nan, nan, nan],
...,
...
...,
[nan, nan, nan, ..., nan, nan, nan],
[nan, nan, nan, ..., nan, nan, nan],
[nan, nan, nan, ..., nan, nan, nan]],
[[nan, nan, nan, ..., nan, nan, nan],
[nan, nan, nan, ..., nan, nan, nan],
[nan, nan, nan, ..., nan, nan, nan],
...,
[nan, nan, nan, ..., nan, nan, nan],
[nan, nan, nan, ..., nan, nan, nan],
[nan, nan, nan, ..., nan, nan, nan]],
[[nan, nan, nan, ..., nan, nan, nan],
[nan, nan, nan, ..., nan, nan, nan],
[nan, nan, nan, ..., nan, nan, nan],
...,
[nan, nan, nan, ..., nan, nan, nan],
[nan, nan, nan, ..., nan, nan, nan],
[nan, nan, nan, ..., nan, nan, nan]]]], dtype=float32) PHIDP
(time, z, y, x)
float32
nan nan nan nan ... nan nan nan nan
_FillValue : 0.0 units : degrees standard_name : differential_phase_hv Polarization : Horizontal and Vertical coordinates : time range array([[[[nan, nan, nan, ..., nan, nan, nan],
[nan, nan, nan, ..., nan, nan, nan],
[nan, nan, nan, ..., nan, nan, nan],
...,
[nan, nan, nan, ..., nan, nan, nan],
[nan, nan, nan, ..., nan, nan, nan],
[nan, nan, nan, ..., nan, nan, nan]],
[[nan, nan, nan, ..., nan, nan, nan],
[nan, nan, nan, ..., nan, nan, nan],
[nan, nan, nan, ..., nan, nan, nan],
...,
[nan, nan, nan, ..., nan, nan, nan],
[nan, nan, nan, ..., nan, nan, nan],
[nan, nan, nan, ..., nan, nan, nan]],
[[nan, nan, nan, ..., nan, nan, nan],
[nan, nan, nan, ..., nan, nan, nan],
[nan, nan, nan, ..., nan, nan, nan],
...,
...
...,
[nan, nan, nan, ..., nan, nan, nan],
[nan, nan, nan, ..., nan, nan, nan],
[nan, nan, nan, ..., nan, nan, nan]],
[[nan, nan, nan, ..., nan, nan, nan],
[nan, nan, nan, ..., nan, nan, nan],
[nan, nan, nan, ..., nan, nan, nan],
...,
[nan, nan, nan, ..., nan, nan, nan],
[nan, nan, nan, ..., nan, nan, nan],
[nan, nan, nan, ..., nan, nan, nan]],
[[nan, nan, nan, ..., nan, nan, nan],
[nan, nan, nan, ..., nan, nan, nan],
[nan, nan, nan, ..., nan, nan, nan],
...,
[nan, nan, nan, ..., nan, nan, nan],
[nan, nan, nan, ..., nan, nan, nan],
[nan, nan, nan, ..., nan, nan, nan]]]], dtype=float32) RHOHV
(time, z, y, x)
float32
nan nan nan nan ... nan nan nan nan
_FillValue : 0.0 units : standard_name : cross_correlation_ratio_hv Polarization : Horizontal and Vertical coordinates : time range array([[[[nan, nan, nan, ..., nan, nan, nan],
[nan, nan, nan, ..., nan, nan, nan],
[nan, nan, nan, ..., nan, nan, nan],
...,
[nan, nan, nan, ..., nan, nan, nan],
[nan, nan, nan, ..., nan, nan, nan],
[nan, nan, nan, ..., nan, nan, nan]],
[[nan, nan, nan, ..., nan, nan, nan],
[nan, nan, nan, ..., nan, nan, nan],
[nan, nan, nan, ..., nan, nan, nan],
...,
[nan, nan, nan, ..., nan, nan, nan],
[nan, nan, nan, ..., nan, nan, nan],
[nan, nan, nan, ..., nan, nan, nan]],
[[nan, nan, nan, ..., nan, nan, nan],
[nan, nan, nan, ..., nan, nan, nan],
[nan, nan, nan, ..., nan, nan, nan],
...,
...
...,
[nan, nan, nan, ..., nan, nan, nan],
[nan, nan, nan, ..., nan, nan, nan],
[nan, nan, nan, ..., nan, nan, nan]],
[[nan, nan, nan, ..., nan, nan, nan],
[nan, nan, nan, ..., nan, nan, nan],
[nan, nan, nan, ..., nan, nan, nan],
...,
[nan, nan, nan, ..., nan, nan, nan],
[nan, nan, nan, ..., nan, nan, nan],
[nan, nan, nan, ..., nan, nan, nan]],
[[nan, nan, nan, ..., nan, nan, nan],
[nan, nan, nan, ..., nan, nan, nan],
[nan, nan, nan, ..., nan, nan, nan],
...,
[nan, nan, nan, ..., nan, nan, nan],
[nan, nan, nan, ..., nan, nan, nan],
[nan, nan, nan, ..., nan, nan, nan]]]], dtype=float32) ROI
(time, z, y, x)
float32
9.258e+03 9.24e+03 ... 1.026e+04
standard_name : radius_of_influence long_name : Radius of influence for mapping units : m least_significant_digit : 1 _FillValue : -9999.0 array([[[[ 9258.122, 9239.624, 9221.163, ..., 9221.163, 9239.624,
9258.122],
[ 9239.624, 9221.089, 9202.592, ..., 9202.592, 9221.089,
9239.624],
[ 9221.163, 9202.592, 9184.057, ..., 9184.057, 9202.592,
9221.163],
...,
[ 9221.163, 9202.592, 9184.057, ..., 9184.057, 9202.592,
9221.163],
[ 9239.624, 9221.089, 9202.592, ..., 9202.592, 9221.089,
9239.624],
[ 9258.122, 9239.624, 9221.163, ..., 9221.163, 9239.624,
9258.122]],
[[ 9270.622, 9252.124, 9233.663, ..., 9233.663, 9252.124,
9270.622],
[ 9252.124, 9233.589, 9215.092, ..., 9215.092, 9233.589,
9252.124],
[ 9233.663, 9215.092, 9196.557, ..., 9196.557, 9215.092,
9233.663],
...
[10208.663, 10190.092, 10171.557, ..., 10171.557, 10190.092,
10208.663],
[10227.124, 10208.589, 10190.092, ..., 10190.092, 10208.589,
10227.124],
[10245.622, 10227.124, 10208.663, ..., 10208.663, 10227.124,
10245.622]],
[[10258.122, 10239.624, 10221.163, ..., 10221.163, 10239.624,
10258.122],
[10239.624, 10221.089, 10202.592, ..., 10202.592, 10221.089,
10239.624],
[10221.163, 10202.592, 10184.057, ..., 10184.057, 10202.592,
10221.163],
...,
[10221.163, 10202.592, 10184.057, ..., 10184.057, 10202.592,
10221.163],
[10239.624, 10221.089, 10202.592, ..., 10202.592, 10221.089,
10239.624],
[10258.122, 10239.624, 10221.163, ..., 10221.163, 10239.624,
10258.122]]]], dtype=float32) Indexes: (4)
PandasIndex
PandasIndex(CFTimeIndex([2017-11-30 06:15:21.055556],
dtype='object', length=1, calendar='standard', freq=None)) PandasIndex
PandasIndex(Float64Index([    0.0,   250.0,   500.0,   750.0,  1000.0,  1250.0,  1500.0,
               1750.0,  2000.0,  2250.0,  2500.0,  2750.0,  3000.0,  3250.0,
               3500.0,  3750.0,  4000.0,  4250.0,  4500.0,  4750.0,  5000.0,
               5250.0,  5500.0,  5750.0,  6000.0,  6250.0,  6500.0,  6750.0,
               7000.0,  7250.0,  7500.0,  7750.0,  8000.0,  8250.0,  8500.0,
               8750.0,  9000.0,  9250.0,  9500.0,  9750.0, 10000.0, 10250.0,
              10500.0, 10750.0, 11000.0, 11250.0, 11500.0, 11750.0, 12000.0,
              12250.0, 12500.0, 12750.0, 13000.0, 13250.0, 13500.0, 13750.0,
              14000.0, 14250.0, 14500.0, 14750.0, 15000.0, 15250.0, 15500.0,
              15750.0, 16000.0, 16250.0, 16500.0, 16750.0, 17000.0, 17250.0,
              17500.0, 17750.0, 18000.0, 18250.0, 18500.0, 18750.0, 19000.0,
              19250.0, 19500.0, 19750.0, 20000.0],
dtype='float64', name='z')) PandasIndex
PandasIndex(Float64Index([-250000.0, -249000.0, -248000.0, -247000.0, -246000.0, -245000.0,
              -244000.0, -243000.0, -242000.0, -241000.0,
              ...
               241000.0,  242000.0,  243000.0,  244000.0,  245000.0,  246000.0,
               247000.0,  248000.0,  249000.0,  250000.0],
dtype='float64', name='y', length=501)) PandasIndex
PandasIndex(Float64Index([-250000.0, -249000.0, -248000.0, -247000.0, -246000.0, -245000.0,
              -244000.0, -243000.0, -242000.0, -241000.0,
              ...
               241000.0,  242000.0,  243000.0,  244000.0,  245000.0,  246000.0,
               247000.0,  248000.0,  249000.0,  250000.0],
             dtype='float64', name='x', length=501))
Attributes: (0)
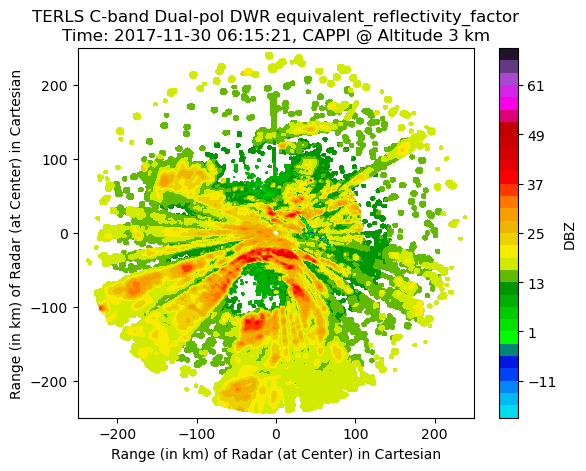
Visualization in Cartesian Plane
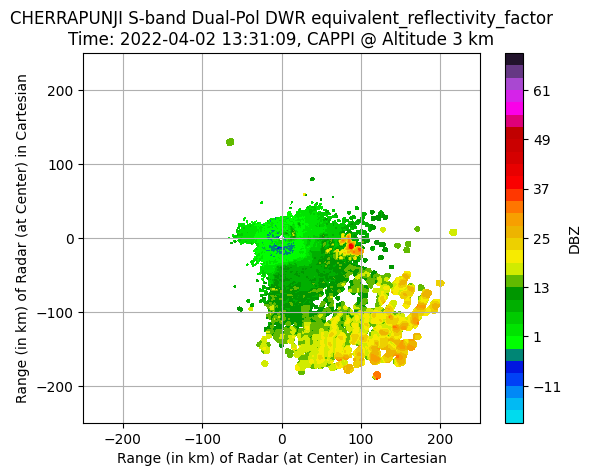
CAPPI@3km
pyiwr.visualize.cappi(xg, altitude_level=3, field_name='DBZ', radar_location='TERLS', grid=False, rings=False,
                                                           ticks_in_km=True, save_image=False, img_name='terlsdbz_cappi3.png')
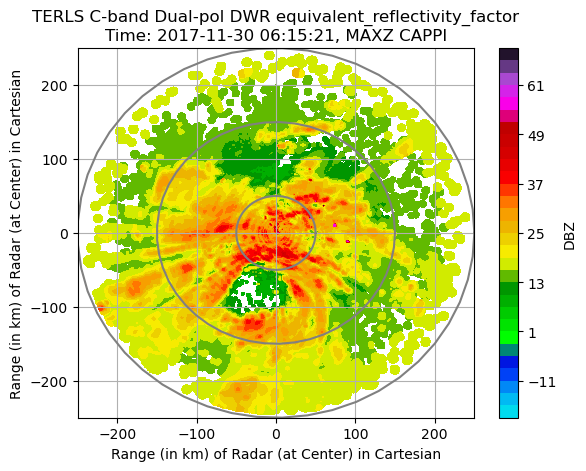
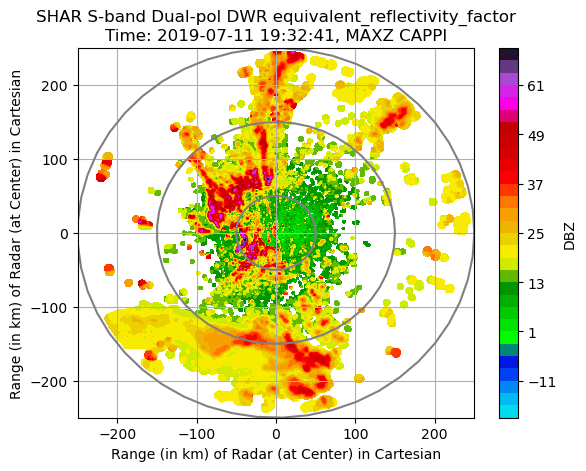
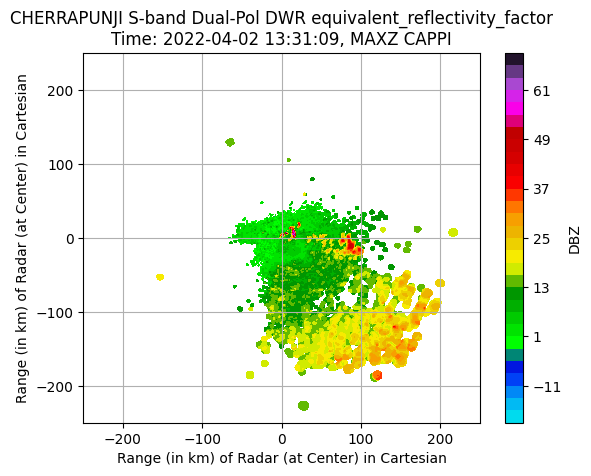
MAXZ CAPPI
pyiwr.visualize.cappi_max(xg, field_name='DBZ ', radar_location='TERLS ', grid=True , rings=True , ticks_in_km=True ,
save_image=False , img_name='terlsdbz_maxcappi.png ')
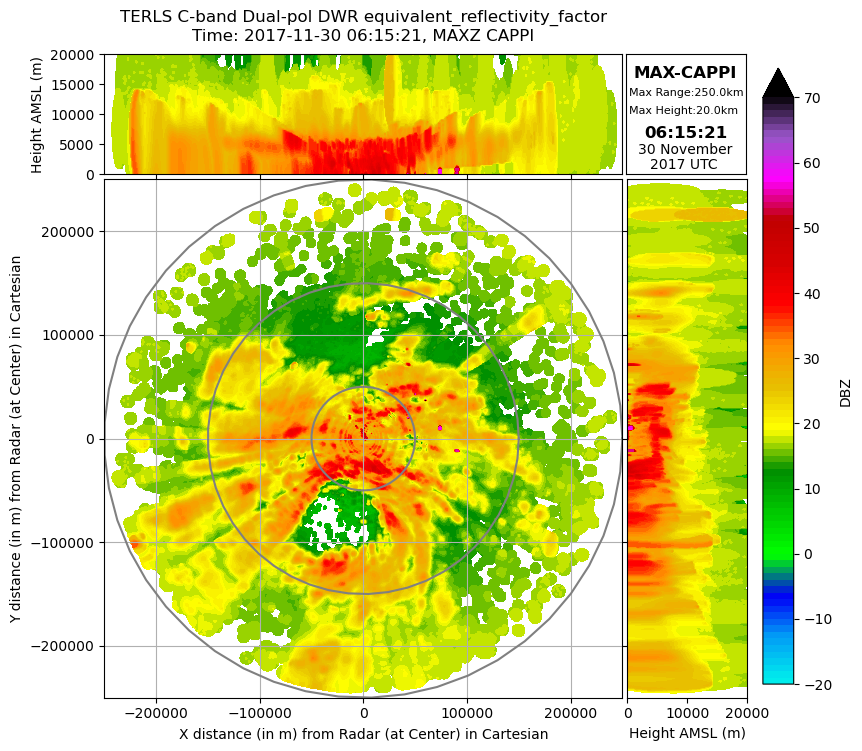
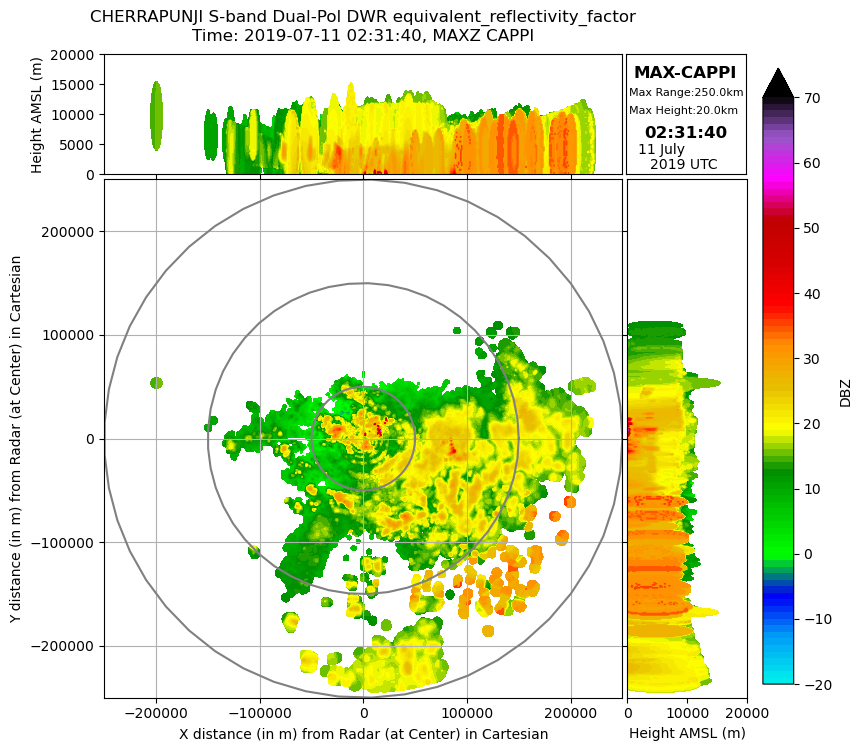
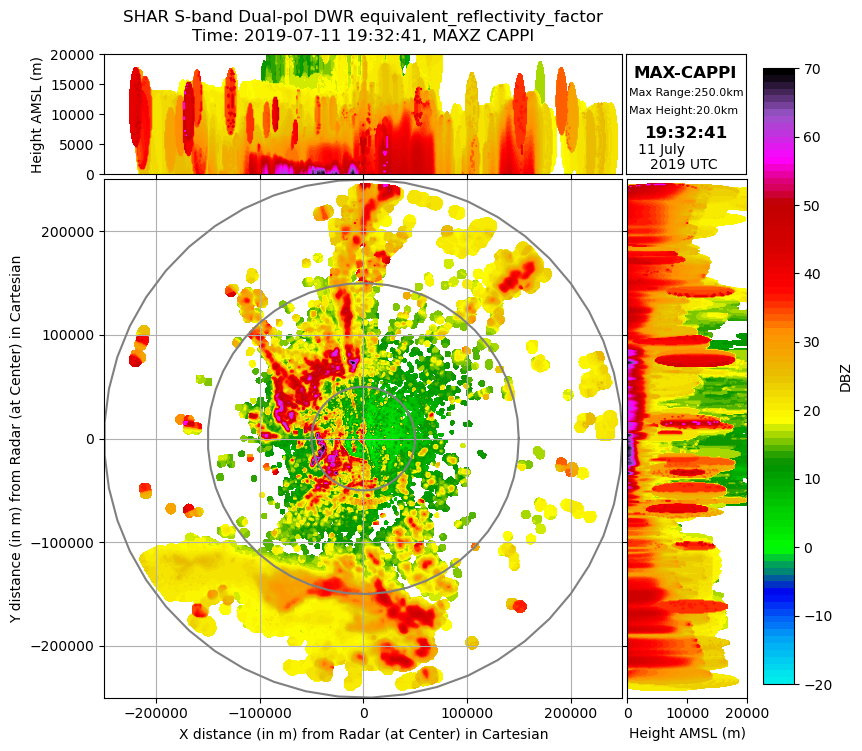
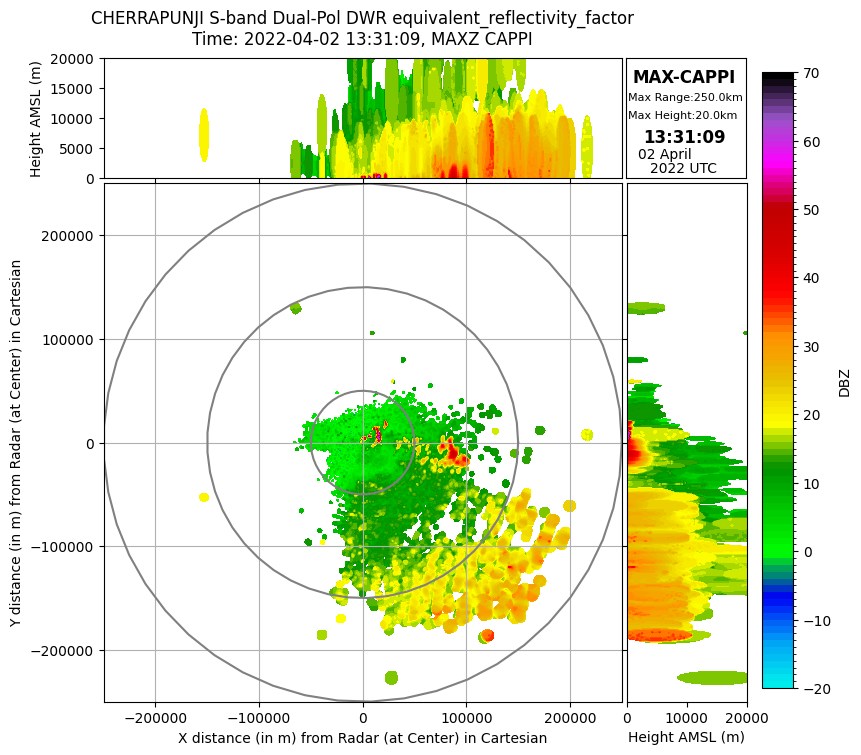
Marginal Distribution of MAXZ CAPPI
pyiwr.visualize.marginal_max(xg, radar_location='TERLS ', field_name='DBZ ', rings=True , grid=True , cross_sections=True ,
save_image=False , img_name='terlsdbz_margmax.png ')
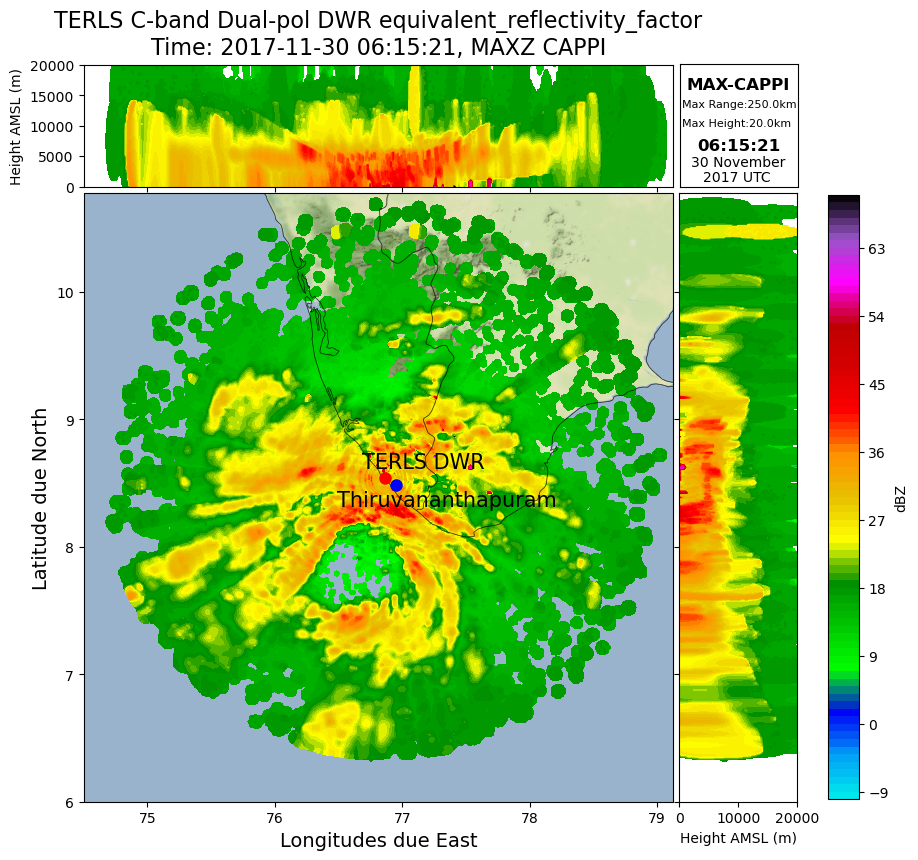
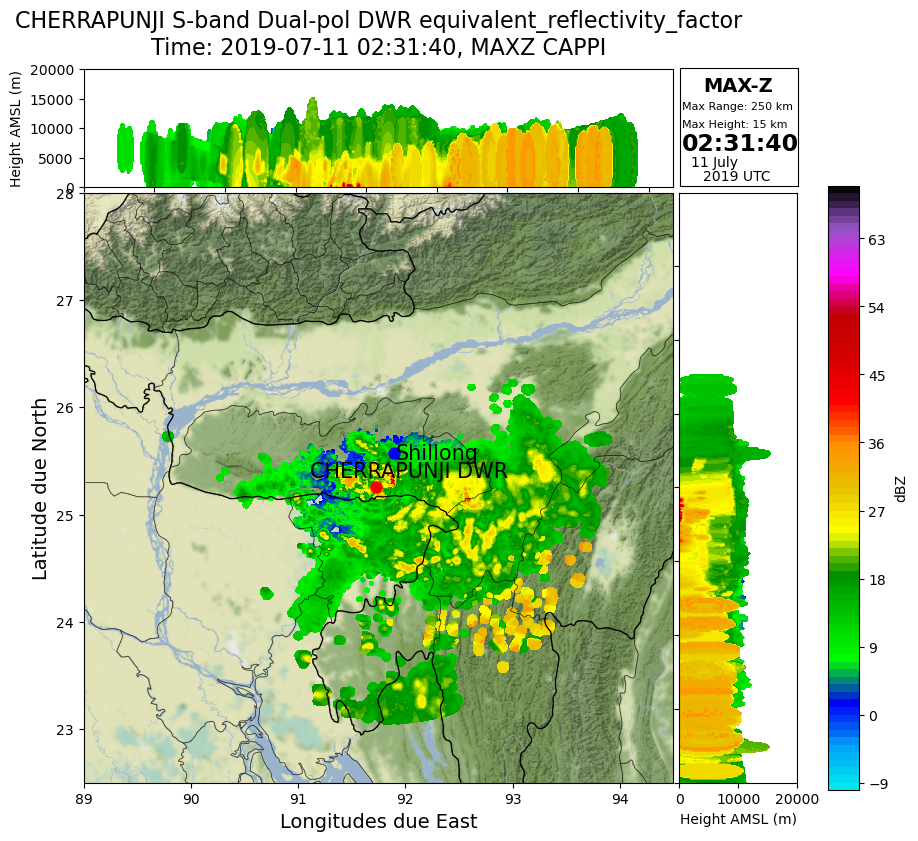
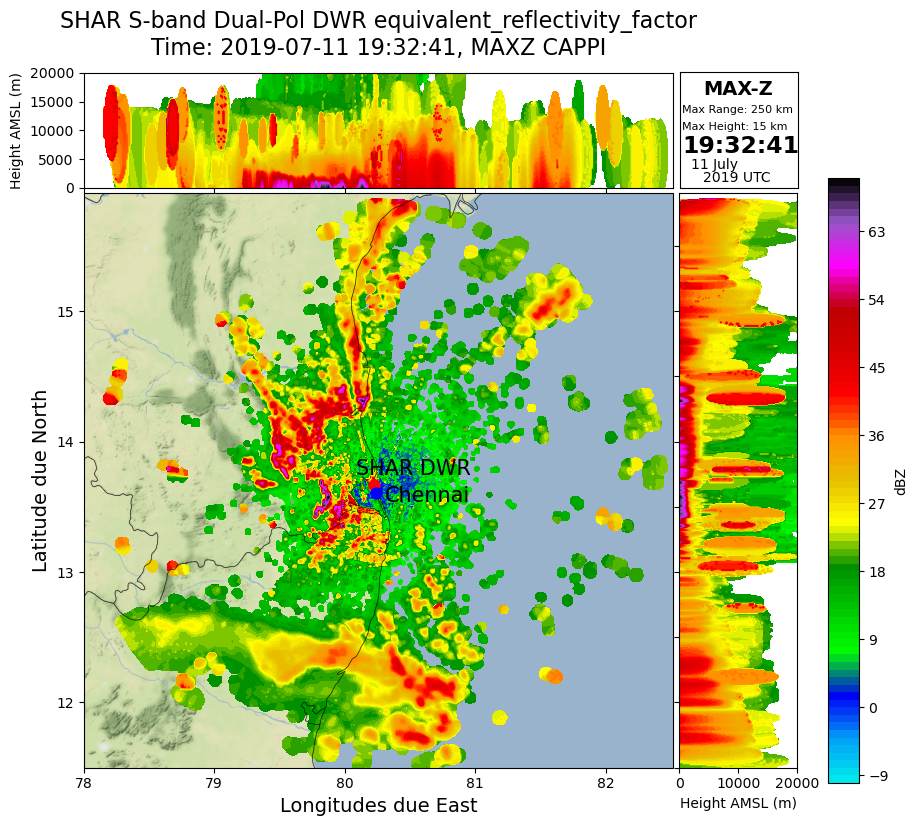
Marginal Distribution of MAXZ CAPPI with background map
pyiwr.visualize .marginal_max_map (xg, radar_location='TERLS' , field_name='DBZ' , background ='terrain-background' ,
cross_sections=True, save_image=False, img_name=None)
Reading content of file and making radar object
SOHRA RADAR
radar1 = pyiwr.format_transform .correctednc (filenamel5, save_file=False)
radar1.info()
Processing file: RSCHR_11JUL2019_023140_L2B_STD.nc
Date Time of Mosdac File RSCHR_11JUL2019_023140_L2B_STD.nc corrected successfully
altitude:
data: <ndarray of type: float64 and shape: (1 ,)>
_FillValue: nan
units: meters
altitude_agl: None
antenna_transition: None
azimuth:
data: <ndarray of type: float32 and shape: (3600 ,)>
_FillValue: nan
standard_name: ray_azimuth_angle
units: degrees
long_name: azimuth_angle_from_true_north
axis: radial_azimuth_coordinate
elevation:
data: <ndarray of type: float32 and shape: (3600 ,)>
_FillValue: nan
standard_name: ray_elevation_angle
units: degrees
long_name: elevation_angle_from_horizontal_plane
axis: radial_azimuth_coordinate
fields:
DBZ:
data: <ndarray of type: float32 and shape: (3600 , 1600 )>
_FillValue: 0.0
units: dBZ
standard_name: equivalent_reflectivity_factor
Polarization: Horizontal
coordinates: time range
VEL:
data: <ndarray of type: float32 and shape: (3600 , 1600 )>
_FillValue: 0.0
units: m/s
standard_name: radial_velocity_of_scatterers_ away_from_instrument
Polarization: Horizontal
coordinates: time range
WIDTH:
data: <ndarray of type: float32 and shape: (3600 , 1600 )>
_FillValue: 0.0
units: m/s
standard_name: doppler_spectrum_width
Polarization: Horizontal
coordinates: time range
ZDR:
data: <ndarray of type: float32 and shape: (3600 , 1600 )>
_FillValue: 0.0
units: dB
standard_name: log_differential_reflectivity_hv
Polarization: Horizontal and Vertical
coordinates: time range
PHIDP:
data: <ndarray of type: float32 and shape: (3600 , 1600 )>
_FillValue: 0.0
units: degrees
standard_name: differential_phase_hv
Polarization: Horizontal and Vertical
coordinates: time range
RHOHV:
data: <ndarray of type: float32 and shape: (3600 , 1600 )>
_FillValue: 0.0
units:
standard_name: cross_correlation_ratio_hv
Polarization: Horizontal and Vertical
coordinates: time range
fixed_angle:
data: <ndarray of type: float32 and shape: (10 ,)>
_FillValue: nan
units: degrees
instrument_parameters: None
latitude:
data: <ndarray of type: float64 and shape: (1 ,)>
_FillValue: nan
units: degrees_north
longitude:
data: <ndarray of type: float64 and shape: (1 ,)>
_FillValue: nan
units: degrees_east
nsweeps: 10
ngates: 1600
nrays: 3600
radar_calibration: None
range:
data: <ndarray of type: float64 and shape: (1600 ,)>
_FillValue: nan
standard_name: projection_range_coordinate
long_name: range_to_measurement_volume
units: meters
spacing_is_constant: true
meters_to_center_of_first_gate: true
axis: radial_range_coordinate
scan_rate: None
scan_type: ppi
sweep_end_ray_index:
data: <ndarray of type: int64 and shape: (10 ,)>
sweep_mode:
data: <ndarray of type: |S1 and shape: (10 , 32 )>
sweep_number:
data: <ndarray of type: int32 and shape: (10 ,)>
sweep_start_ray_index:
data: <ndarray of type: int64 and shape: (10 ,)>
target_scan_rate: None
time:
data: <ndarray of type: float64 and shape: (3600 ,)>
_FillValue: nan
standard_name: time
long_name: time_in_seconds_since_volume_start
units: seconds since 2019 -07 -11 T02:31 :40
calendar: gregorian
metadata:
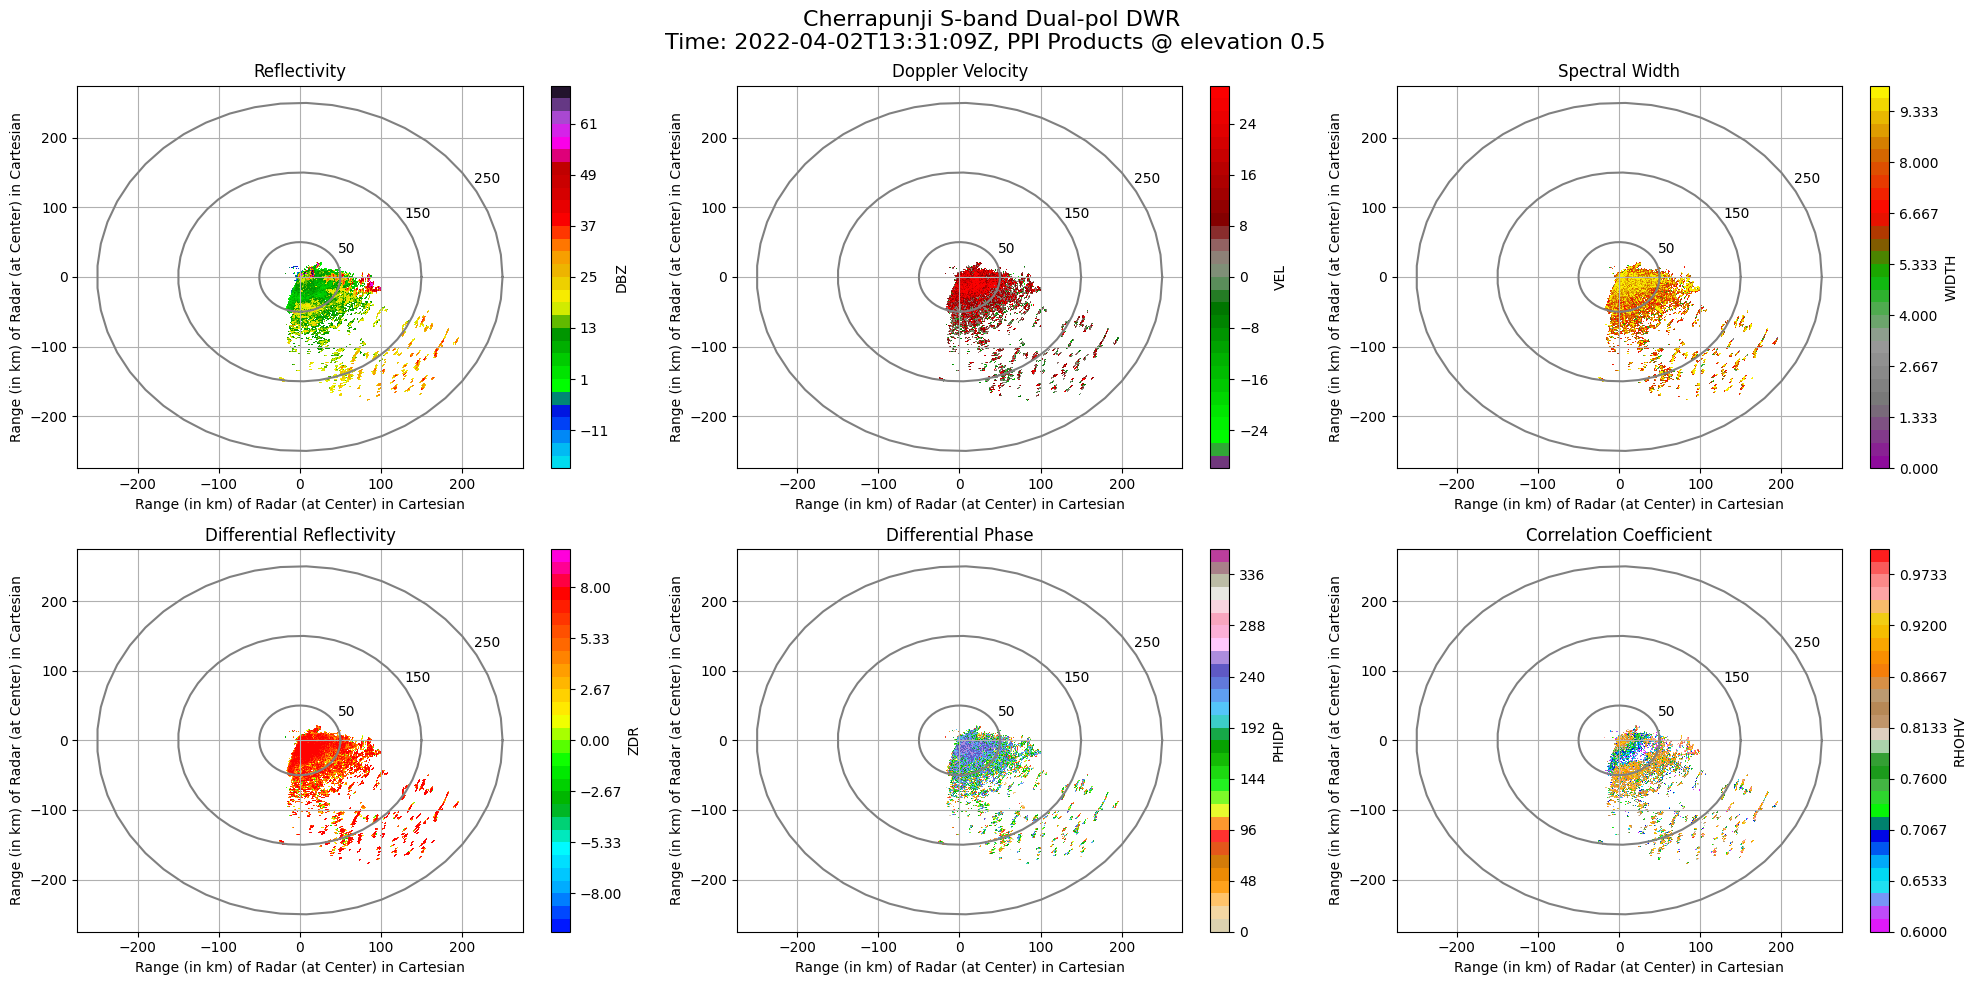
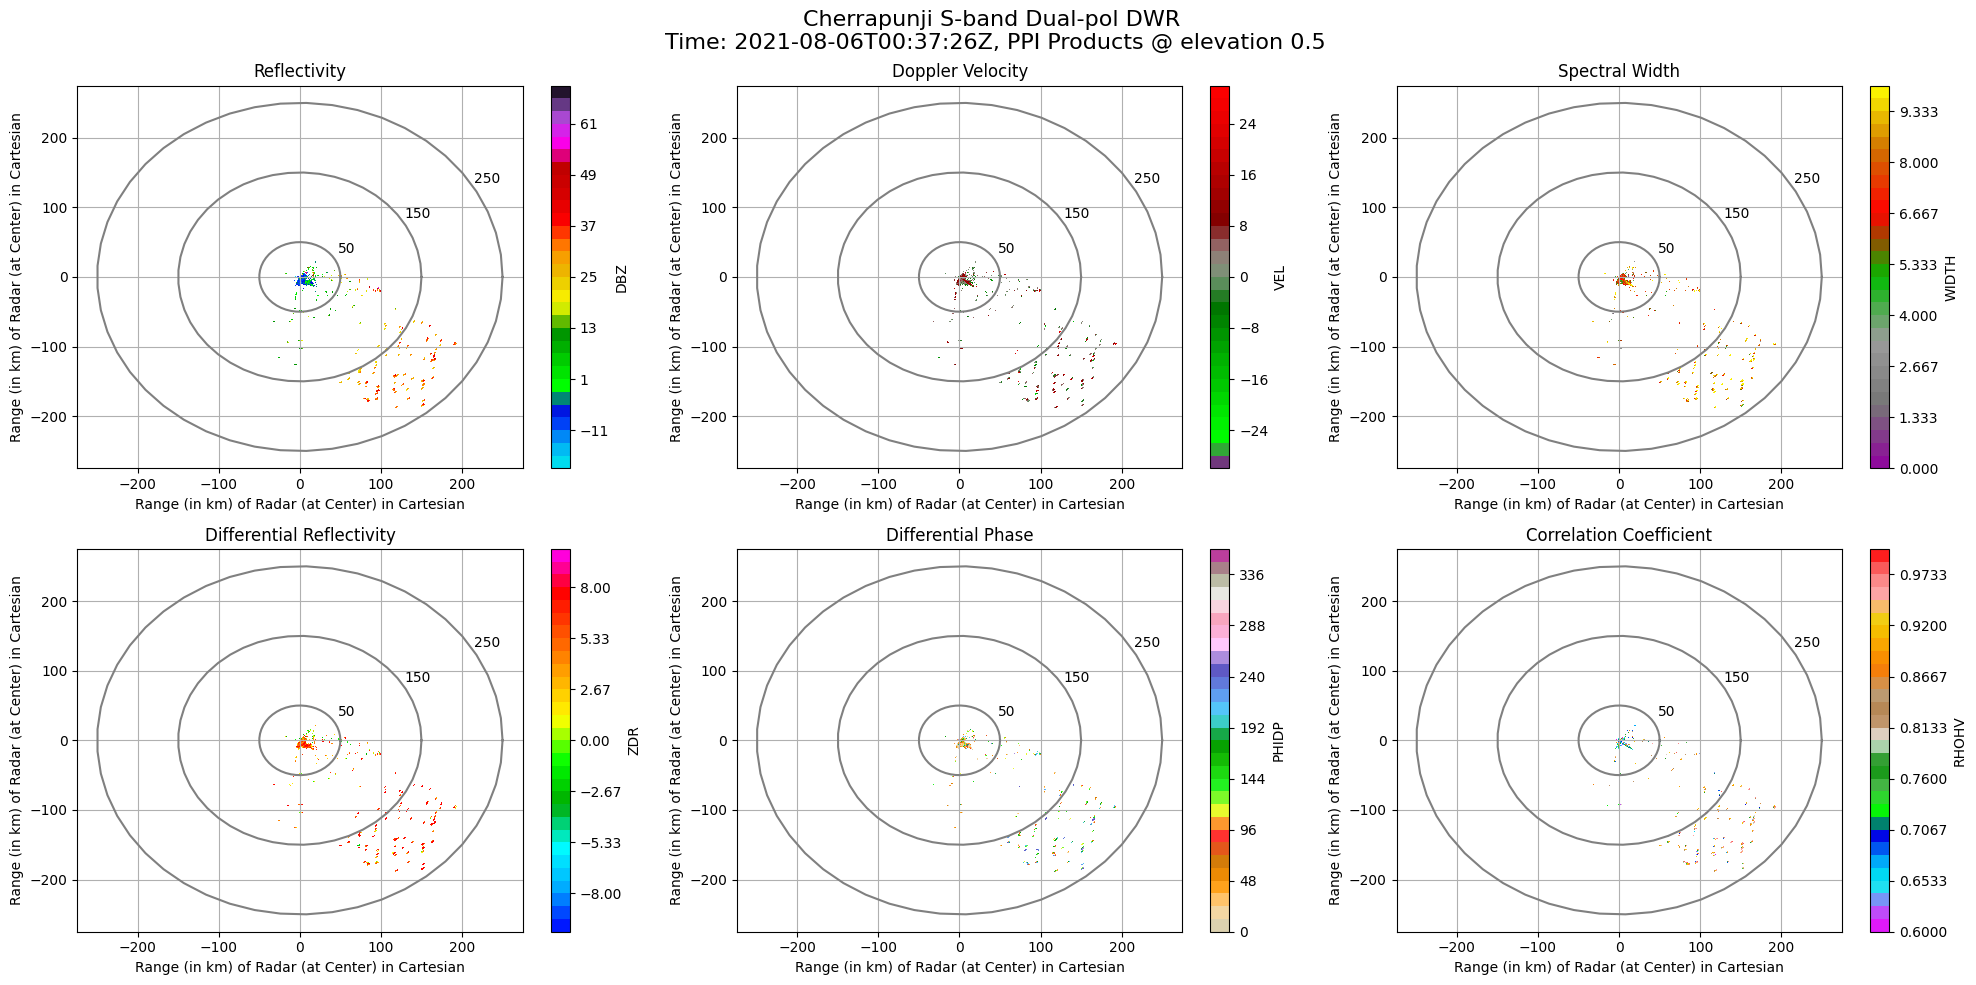
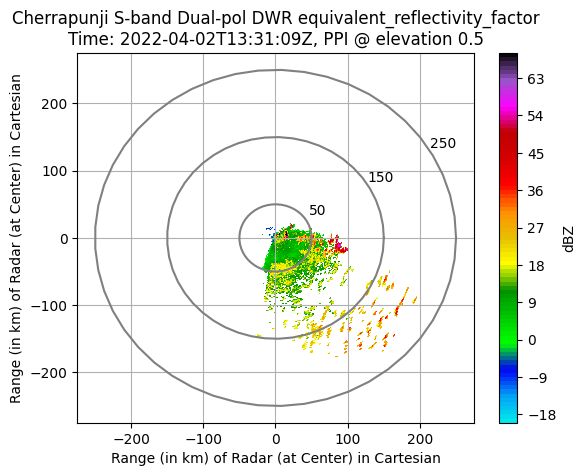
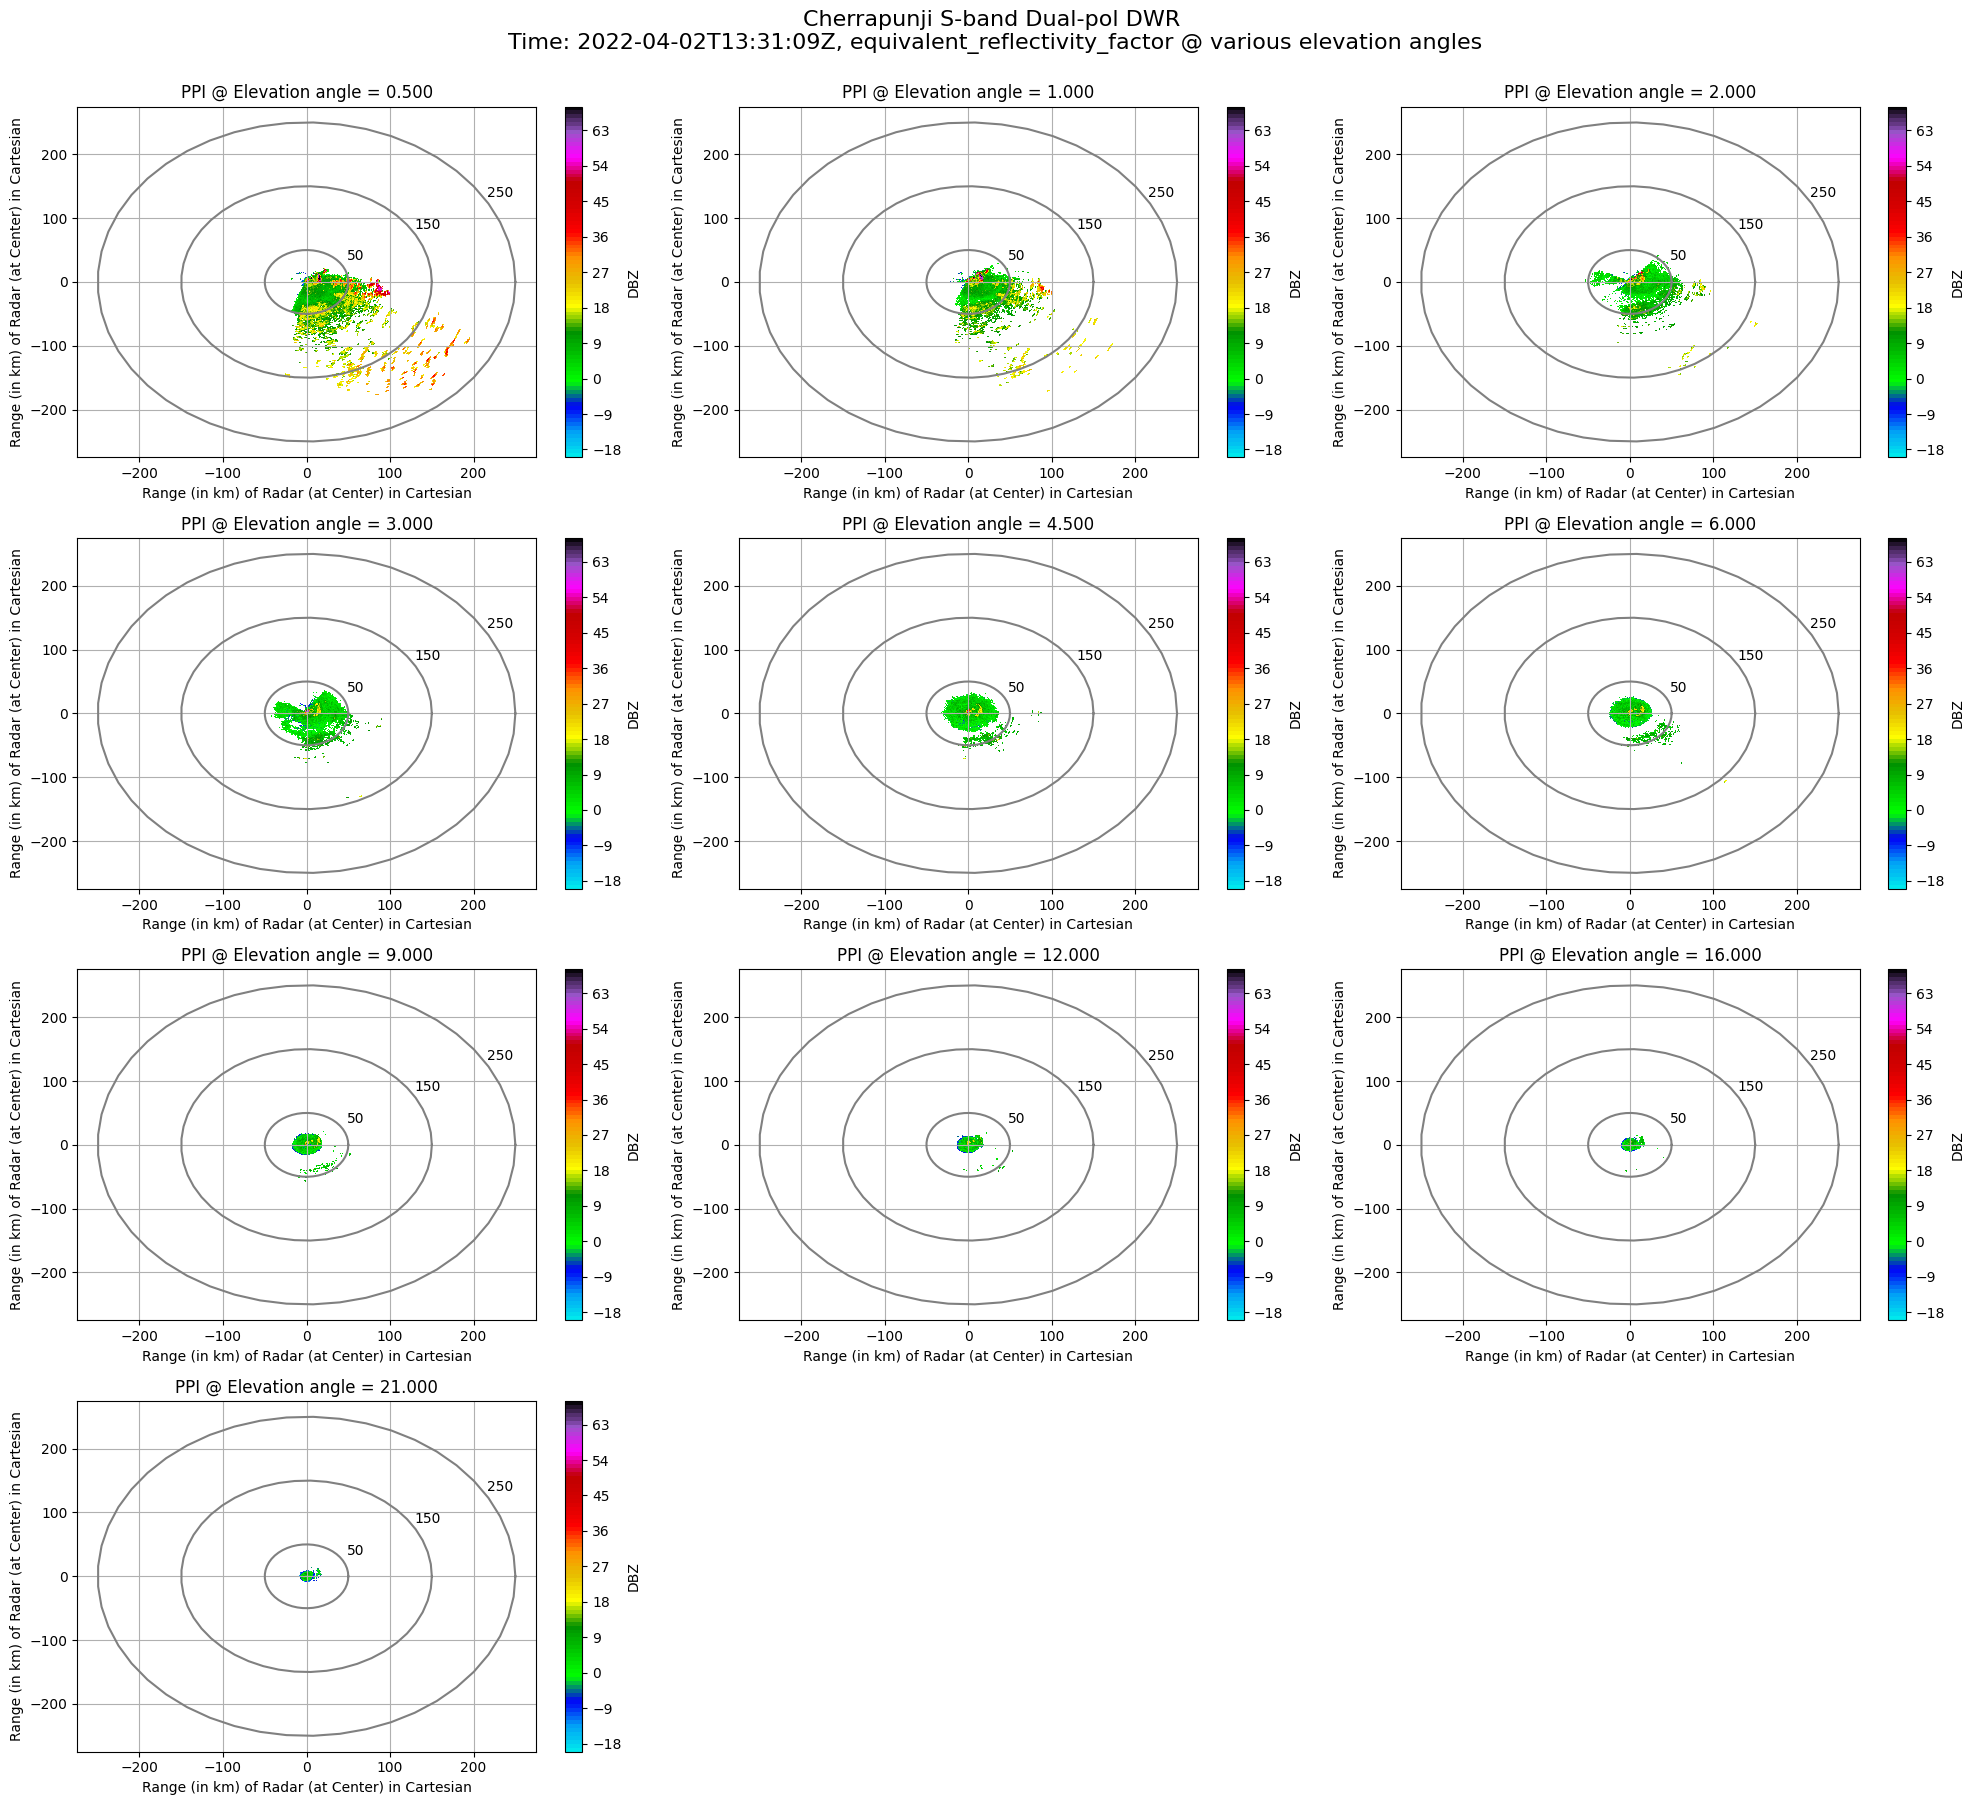
instrument_name: Cherrapunji S-band Dual-pol DWR
Created using: pyiwr (Indian Weather Radar) Module developed by Researchers at SIGMA Research Lab, IIT Indore
version: Version 1.0
title: Cherrapunji SDWR data
institution: ISRO
references: Py-art_https://arm-doe.github.io/pyart/notebooks/basic_ingest_using_test_radar_object.html
source: DWR volume scan data
comment:
Conventions: CF/Radial
field_names: DBZ, VEL, WIDTH, ZDR, PHIDP, RHOHV
history: DWR mosdac files (.nc) data encoded into Py-ART compatible NetCDF file
volume_number: 0
platform_type: fixed
instrument_type: radar
primary_axis: axis_z
Visualization in Cartesian Plane
PPI Plot of any Radar Field at any given elevation angle
pyiwr.visualize.elevation(radar1, field_name='DBZ', elevation_index=0, rings=True, grid=True,
                                                 range_in_km=True, save_image=False, img_name='terls_dbz0.png')
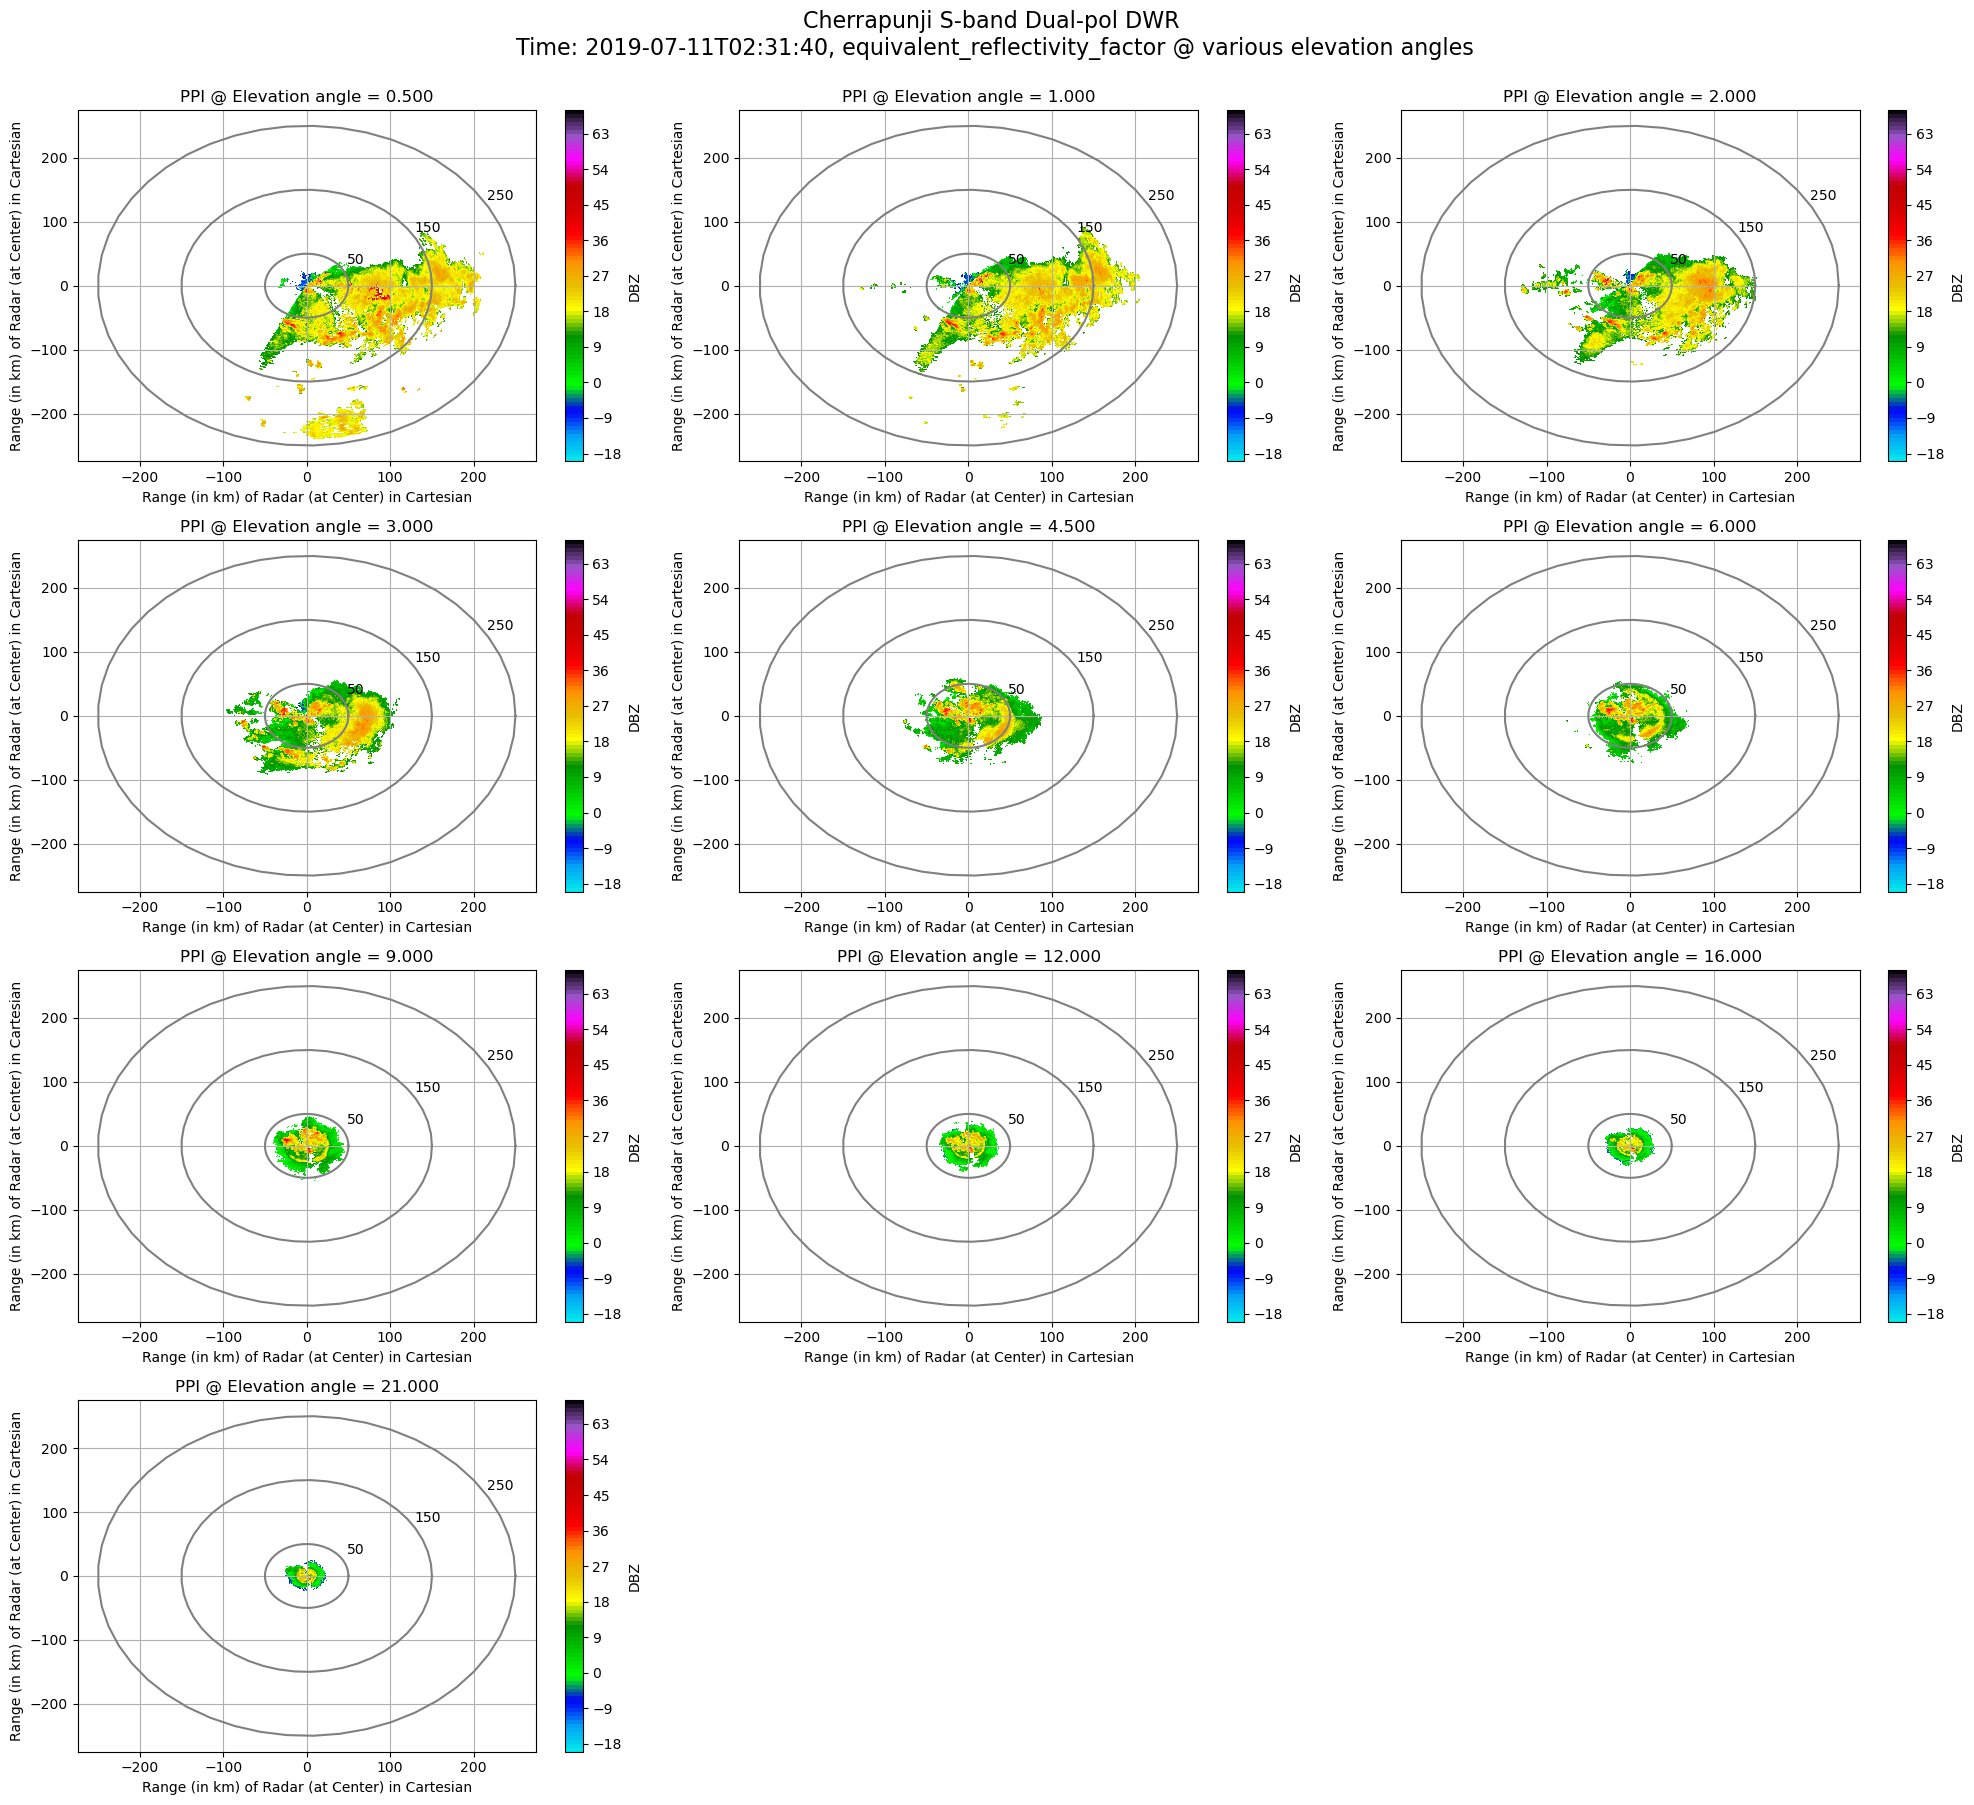
PPI Plots at all elevation angle of any Radar Field
pyiwr.visualize.all_elevation(radar1, field_name='DBZ ', rings=True , grid=True , range_in_km=True ,
save_image=False , img_name='terls_dbzall.png ')
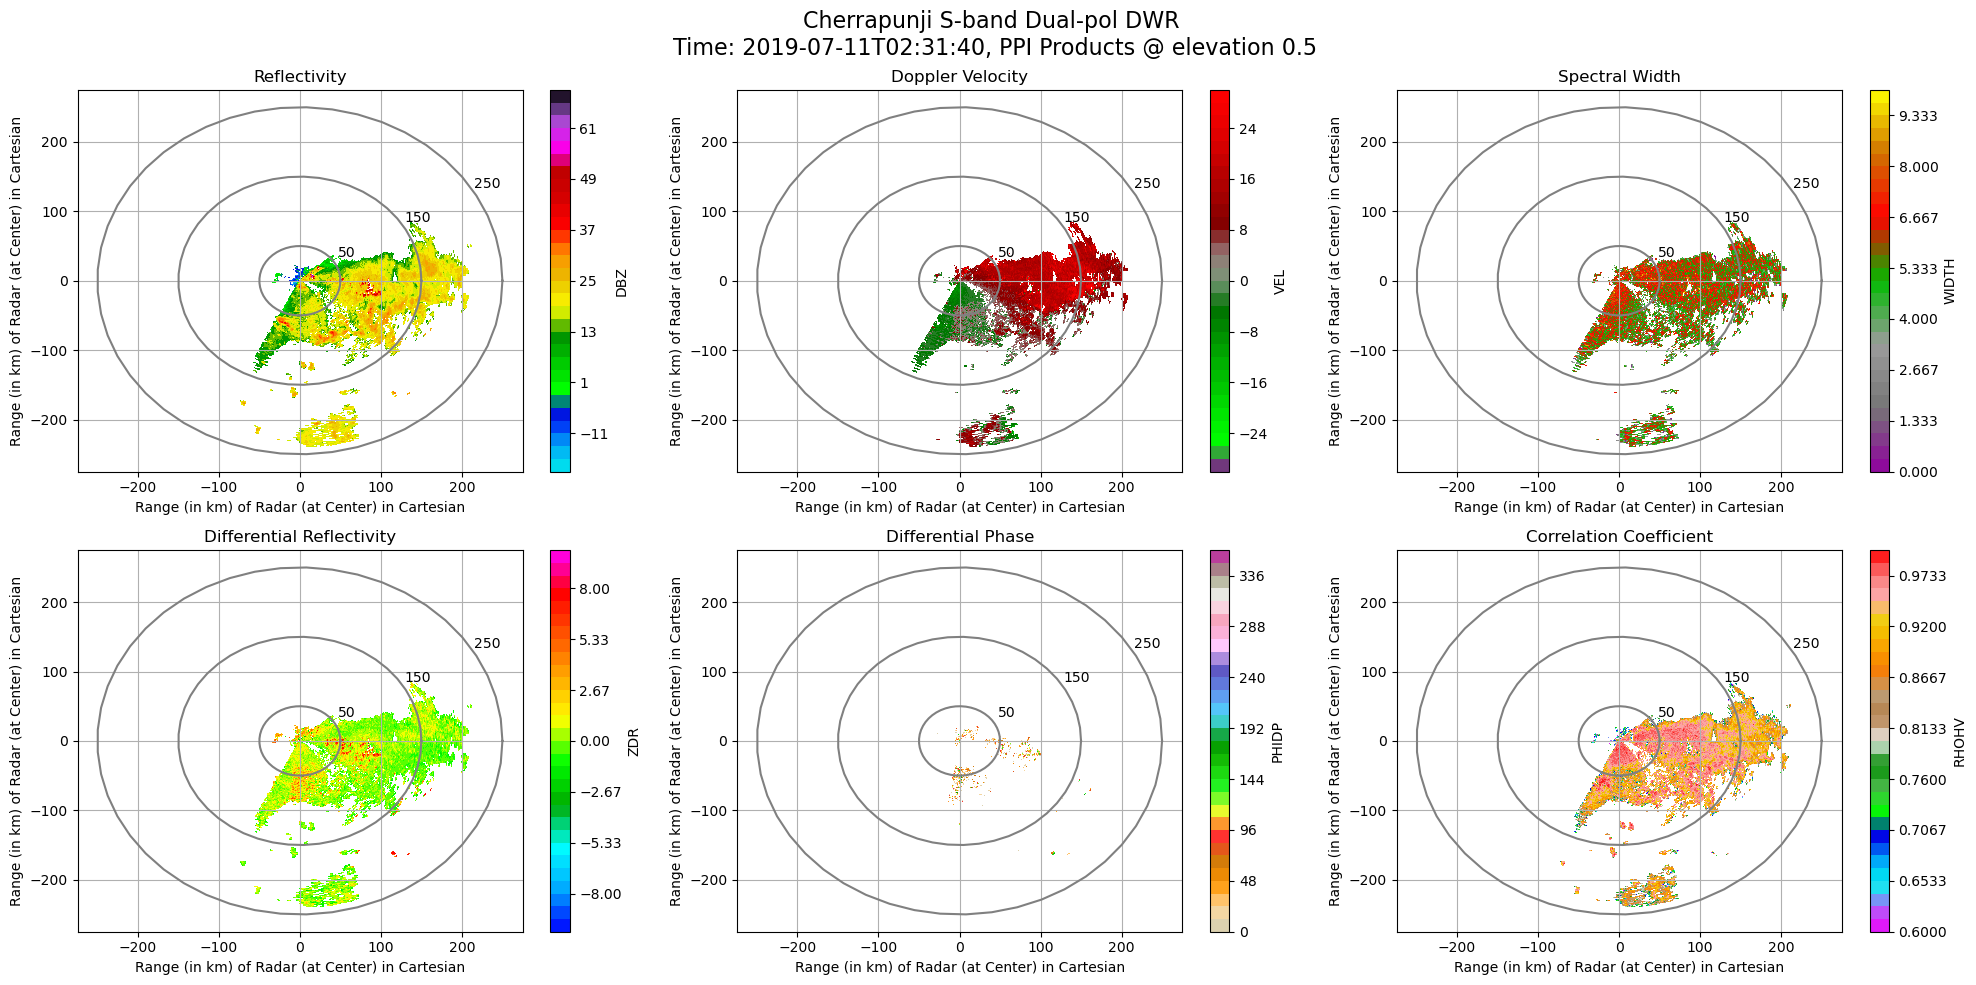
PPI Plots of all Radar Fields at any given elevation angle
pyiwr.visualize.fields_elevation(radar1, elevation_index=0, range_in_km=True, rings=True, grid=True,
                                                                 save_image=False, img_name='terls_fieldall.png')
Reading content of file and making grid object
xg1 = pyiwr.format_transform.sweeps2gridnc(filenamel5, grid_shape=(81 , 501 , 501 ), height=20 , length=250 , save_file=False)
xg1
Processing file : RSCHR_11JUL2019_023140_L2B_STD.nc
Xarray gridding of volumetric sweeps of radar PPI scan file : RSCHR_11JUL2019_023140_L2B_STD.nc done successfully
<xarray.Dataset>
Dimensions:  (time: 1, z: 81, y: 501, x: 501)
Coordinates:
   time     (time) object 2019-07-11 02:31:40.055556
   z        (z) float64 0.0 250.0 500.0 750.0 ... 1.95e+04 1.975e+04 2e+04
    lat      (y) float64 23.0 23.01 23.02 23.03 23.04 ... 27.47 27.48 27.49 27.5
    lon      (x) float64 89.29 89.3 89.31 89.32 ... 94.15 94.16 94.17 94.18
   y        (y) float64 -2.5e+05 -2.49e+05 -2.48e+05 ... 2.49e+05 2.5e+05
  * x        (x) float64 -2.5e+05 -2.49e+05 -2.48e+05 ... 2.49e+05 2.5e+05
Data variables:
    DBZ      (time, z, y, x) float32 nan nan nan nan nan ... nan nan nan nan nan
    VEL      (time, z, y, x) float32 nan nan nan nan nan ... nan nan nan nan nan
    WIDTH    (time, z, y, x) float32 nan nan nan nan nan ... nan nan nan nan nan
    ZDR      (time, z, y, x) float32 nan nan nan nan nan ... nan nan nan nan nan
    PHIDP    (time, z, y, x) float32 nan nan nan nan nan ... nan nan nan nan nan
    RHOHV    (time, z, y, x) float32 nan nan nan nan nan ... nan nan nan nan nan
ROI (time, z, y, x) float32 9.258e+03 9.24e+03 ... 1.024e+04 1.026e+04 Dimensions:
Coordinates: (6)
time
(time)
object
2019-07-11 02:31:40.055556
array([cftime.DatetimeGregorian(2019, 7, 11, 2, 31, 40, 55556, has_year_zero=False)],
      dtype=object)
z
(z)
float64
0.0 250.0 500.0 ... 1.975e+04 2e+04
standard_name : projection_z_coordinate long_name : Z distance on the projection plane from the origin axis : Z units : m positive : up array([ 0., 250., 500., 750., 1000., 1250., 1500., 1750., 2000.,
2250., 2500., 2750., 3000., 3250., 3500., 3750., 4000., 4250.,
4500., 4750., 5000., 5250., 5500., 5750., 6000., 6250., 6500.,
6750., 7000., 7250., 7500., 7750., 8000., 8250., 8500., 8750.,
9000., 9250., 9500., 9750., 10000., 10250., 10500., 10750., 11000.,
11250., 11500., 11750., 12000., 12250., 12500., 12750., 13000., 13250.,
13500., 13750., 14000., 14250., 14500., 14750., 15000., 15250., 15500.,
15750., 16000., 16250., 16500., 16750., 17000., 17250., 17500., 17750.,
18000., 18250., 18500., 18750., 19000., 19250., 19500., 19750., 20000.]) lat
(y)
float64
23.0 23.01 23.02 ... 27.49 27.5
long_name : latitude of grid cell center units : degree_N standard_name : Latitude array([23.00051195, 23.00950154, 23.01849112, 23.02748071, 23.03647029,
23.04545987, 23.05444946, 23.06343904, 23.07242862, 23.0814182 ,
23.09040778, 23.09939736, 23.10838693, 23.11737651, 23.12636609,
23.13535566, 23.14434523, 23.15333481, 23.16232438, 23.17131395,
23.18030352, 23.18929309, 23.19828266, 23.20727223, 23.2162618 ,
23.22525137, 23.23424093, 23.2432305 , 23.25222006, 23.26120962,
23.27019919, 23.27918875, 23.28817831, 23.29716787, 23.30615743,
23.31514699, 23.32413655, 23.3331261 , 23.34211566, 23.35110521,
23.36009477, 23.36908432, 23.37807387, 23.38706343, 23.39605298,
23.40504253, 23.41403208, 23.42302163, 23.43201117, 23.44100072,
23.44999027, 23.45897981, 23.46796936, 23.4769589 , 23.48594844,
23.49493798, 23.50392752, 23.51291707, 23.5219066 , 23.53089614,
23.53988568, 23.54887522, 23.55786475, 23.56685429, 23.57584382,
23.58483336, 23.59382289, 23.60281242, 23.61180195, 23.62079148,
23.62978101, 23.63877054, 23.64776007, 23.6567496 , 23.66573912,
23.67472865, 23.68371817, 23.69270769, 23.70169722, 23.71068674,
23.71967626, 23.72866578, 23.7376553 , 23.74664482, 23.75563433,
23.76462385, 23.77361337, 23.78260288, 23.7915924 , 23.80058191,
23.80957142, 23.81856093, 23.82755044, 23.83653995, 23.84552946,
23.85451897, 23.86350848, 23.87249799, 23.88148749, 23.890477 ,
...
26.64122358, 26.6502128 , 26.65920203, 26.66819125, 26.67718047,
26.68616969, 26.69515891, 26.70414813, 26.71313735, 26.72212656,
26.73111578, 26.740105 , 26.74909421, 26.75808342, 26.76707263,
26.77606184, 26.78505105, 26.79404026, 26.80302947, 26.81201868,
26.82100788, 26.82999709, 26.83898629, 26.84797549, 26.8569647 ,
26.8659539 , 26.8749431 , 26.8839323 , 26.89292149, 26.90191069,
26.91089989, 26.91988908, 26.92887827, 26.93786747, 26.94685666,
26.95584585, 26.96483504, 26.97382423, 26.98281342, 26.9918026 ,
27.00079179, 27.00978098, 27.01877016, 27.02775934, 27.03674852,
27.0457377 , 27.05472688, 27.06371606, 27.07270524, 27.08169442,
27.09068359, 27.09967277, 27.10866194, 27.11765112, 27.12664029,
27.13562946, 27.14461863, 27.1536078 , 27.16259697, 27.17158613,
27.1805753 , 27.18956446, 27.19855363, 27.20754279, 27.21653195,
27.22552111, 27.23451027, 27.24349943, 27.25248859, 27.26147775,
27.2704669 , 27.27945606, 27.28844521, 27.29743436, 27.30642352,
27.31541267, 27.32440182, 27.33339097, 27.34238011, 27.35136926,
27.36035841, 27.36934755, 27.37833669, 27.38732584, 27.39631498,
27.40530412, 27.41429326, 27.4232824 , 27.43227153, 27.44126067,
27.45024981, 27.45923894, 27.46822807, 27.47721721, 27.48620634,
27.49519547]) lon
(x)
float64
89.29 89.3 89.31 ... 94.17 94.18
long_name : longitude of grid cell center units : degree_E standard_name : Longitude array([89.29123541, 89.3010013 , 89.31076721, 89.32053315, 89.33029912,
89.3400651 , 89.34983111, 89.35959715, 89.3693632 , 89.37912928,
89.38889538, 89.39866151, 89.40842765, 89.41819382, 89.42796002,
89.43772623, 89.44749247, 89.45725873, 89.46702501, 89.47679131,
89.48655764, 89.49632398, 89.50609035, 89.51585674, 89.52562315,
89.53538959, 89.54515604, 89.55492252, 89.56468901, 89.57445553,
89.58422207, 89.59398863, 89.60375521, 89.61352181, 89.62328844,
89.63305508, 89.64282174, 89.65258842, 89.66235513, 89.67212185,
89.6818886 , 89.69165536, 89.70142214, 89.71118895, 89.72095577,
89.73072261, 89.74048947, 89.75025635, 89.76002325, 89.76979017,
89.77955711, 89.78932407, 89.79909105, 89.80885804, 89.81862506,
89.82839209, 89.83815914, 89.84792621, 89.8576933 , 89.8674604 ,
89.87722753, 89.88699467, 89.89676183, 89.90652901, 89.9162962 ,
89.92606342, 89.93583065, 89.9455979 , 89.95536516, 89.96513245,
89.97489975, 89.98466706, 89.9944344 , 90.00420175, 90.01396912,
90.0237365 , 90.03350391, 90.04327132, 90.05303876, 90.06280621,
90.07257368, 90.08234116, 90.09210866, 90.10187617, 90.1116437 ,
90.12141125, 90.13117881, 90.14094639, 90.15071399, 90.16048159,
90.17024922, 90.18001686, 90.18978451, 90.19955218, 90.20931987,
90.21908757, 90.22885528, 90.23862301, 90.24839075, 90.25815851,
...
93.24731243, 93.25708013, 93.26684782, 93.27661549, 93.28638314,
93.29615078, 93.30591841, 93.31568601, 93.32545361, 93.33522119,
93.34498875, 93.3547563 , 93.36452383, 93.37429134, 93.38405884,
93.39382632, 93.40359379, 93.41336124, 93.42312868, 93.43289609,
93.4426635 , 93.45243088, 93.46219825, 93.4719656 , 93.48173294,
93.49150025, 93.50126755, 93.51103484, 93.5208021 , 93.53056935,
93.54033658, 93.5501038 , 93.55987099, 93.56963817, 93.57940533,
93.58917247, 93.5989396 , 93.6087067 , 93.61847379, 93.62824086,
93.63800791, 93.64777494, 93.65754196, 93.66730895, 93.67707593,
93.68684289, 93.69660983, 93.70637675, 93.71614365, 93.72591053,
93.73567739, 93.74544423, 93.75521105, 93.76497786, 93.77474464,
93.7845114 , 93.79427815, 93.80404487, 93.81381158, 93.82357826,
93.83334492, 93.84311156, 93.85287819, 93.86264479, 93.87241137,
93.88217793, 93.89194447, 93.90171099, 93.91147748, 93.92124396,
93.93101041, 93.94077685, 93.95054326, 93.96030965, 93.97007602,
93.97984236, 93.98960869, 93.99937499, 94.00914127, 94.01890753,
94.02867377, 94.03843998, 94.04820618, 94.05797235, 94.06773849,
94.07750462, 94.08727072, 94.0970368 , 94.10680285, 94.11656889,
94.1263349 , 94.13610088, 94.14586685, 94.15563279, 94.1653987 ,
94.17516459]) y
(y)
float64
-2.5e+05 -2.49e+05 ... 2.5e+05
standard_name : projection_y_coordinate long_name : Y distance on the projection plane from the origin axis : Y units : m array([-250000., -249000., -248000., ..., 248000., 249000., 250000.]) x
(x)
float64
-2.5e+05 -2.49e+05 ... 2.5e+05
standard_name : projection_x_coordinate long_name : X distance on the projection plane from the origin axis : X units : m array([-250000., -249000., -248000., ..., 248000., 249000., 250000.]) Data variables: (7)
DBZ
(time, z, y, x)
float32
nan nan nan nan ... nan nan nan nan
_FillValue : 0.0 units : dBZ standard_name : equivalent_reflectivity_factor Polarization : Horizontal coordinates : time range array([[[[nan, nan, nan, ..., nan, nan, nan],
[nan, nan, nan, ..., nan, nan, nan],
[nan, nan, nan, ..., nan, nan, nan],
...,
[nan, nan, nan, ..., nan, nan, nan],
[nan, nan, nan, ..., nan, nan, nan],
[nan, nan, nan, ..., nan, nan, nan]],
[[nan, nan, nan, ..., nan, nan, nan],
[nan, nan, nan, ..., nan, nan, nan],
[nan, nan, nan, ..., nan, nan, nan],
...,
[nan, nan, nan, ..., nan, nan, nan],
[nan, nan, nan, ..., nan, nan, nan],
[nan, nan, nan, ..., nan, nan, nan]],
[[nan, nan, nan, ..., nan, nan, nan],
[nan, nan, nan, ..., nan, nan, nan],
[nan, nan, nan, ..., nan, nan, nan],
...,
...
...,
[nan, nan, nan, ..., nan, nan, nan],
[nan, nan, nan, ..., nan, nan, nan],
[nan, nan, nan, ..., nan, nan, nan]],
[[nan, nan, nan, ..., nan, nan, nan],
[nan, nan, nan, ..., nan, nan, nan],
[nan, nan, nan, ..., nan, nan, nan],
...,
[nan, nan, nan, ..., nan, nan, nan],
[nan, nan, nan, ..., nan, nan, nan],
[nan, nan, nan, ..., nan, nan, nan]],
[[nan, nan, nan, ..., nan, nan, nan],
[nan, nan, nan, ..., nan, nan, nan],
[nan, nan, nan, ..., nan, nan, nan],
...,
[nan, nan, nan, ..., nan, nan, nan],
[nan, nan, nan, ..., nan, nan, nan],
[nan, nan, nan, ..., nan, nan, nan]]]], dtype=float32) VEL
(time, z, y, x)
float32
nan nan nan nan ... nan nan nan nan
_FillValue : 0.0 units : m/s standard_name : radial_velocity_ofscatterers away_from_instrument Polarization : Horizontal coordinates : time range array([[[[nan, nan, nan, ..., nan, nan, nan],
[nan, nan, nan, ..., nan, nan, nan],
[nan, nan, nan, ..., nan, nan, nan],
...,
[nan, nan, nan, ..., nan, nan, nan],
[nan, nan, nan, ..., nan, nan, nan],
[nan, nan, nan, ..., nan, nan, nan]],
[[nan, nan, nan, ..., nan, nan, nan],
[nan, nan, nan, ..., nan, nan, nan],
[nan, nan, nan, ..., nan, nan, nan],
...,
[nan, nan, nan, ..., nan, nan, nan],
[nan, nan, nan, ..., nan, nan, nan],
[nan, nan, nan, ..., nan, nan, nan]],
[[nan, nan, nan, ..., nan, nan, nan],
[nan, nan, nan, ..., nan, nan, nan],
[nan, nan, nan, ..., nan, nan, nan],
...,
...
...,
[nan, nan, nan, ..., nan, nan, nan],
[nan, nan, nan, ..., nan, nan, nan],
[nan, nan, nan, ..., nan, nan, nan]],
[[nan, nan, nan, ..., nan, nan, nan],
[nan, nan, nan, ..., nan, nan, nan],
[nan, nan, nan, ..., nan, nan, nan],
...,
[nan, nan, nan, ..., nan, nan, nan],
[nan, nan, nan, ..., nan, nan, nan],
[nan, nan, nan, ..., nan, nan, nan]],
[[nan, nan, nan, ..., nan, nan, nan],
[nan, nan, nan, ..., nan, nan, nan],
[nan, nan, nan, ..., nan, nan, nan],
...,
[nan, nan, nan, ..., nan, nan, nan],
[nan, nan, nan, ..., nan, nan, nan],
[nan, nan, nan, ..., nan, nan, nan]]]], dtype=float32) WIDTH
(time, z, y, x)
float32
nan nan nan nan ... nan nan nan nan
_FillValue : 0.0 units : m/s standard_name : doppler_spectrum_width Polarization : Horizontal coordinates : time range array([[[[nan, nan, nan, ..., nan, nan, nan],
[nan, nan, nan, ..., nan, nan, nan],
[nan, nan, nan, ..., nan, nan, nan],
...,
[nan, nan, nan, ..., nan, nan, nan],
[nan, nan, nan, ..., nan, nan, nan],
[nan, nan, nan, ..., nan, nan, nan]],
[[nan, nan, nan, ..., nan, nan, nan],
[nan, nan, nan, ..., nan, nan, nan],
[nan, nan, nan, ..., nan, nan, nan],
...,
[nan, nan, nan, ..., nan, nan, nan],
[nan, nan, nan, ..., nan, nan, nan],
[nan, nan, nan, ..., nan, nan, nan]],
[[nan, nan, nan, ..., nan, nan, nan],
[nan, nan, nan, ..., nan, nan, nan],
[nan, nan, nan, ..., nan, nan, nan],
...,
...
...,
[nan, nan, nan, ..., nan, nan, nan],
[nan, nan, nan, ..., nan, nan, nan],
[nan, nan, nan, ..., nan, nan, nan]],
[[nan, nan, nan, ..., nan, nan, nan],
[nan, nan, nan, ..., nan, nan, nan],
[nan, nan, nan, ..., nan, nan, nan],
...,
[nan, nan, nan, ..., nan, nan, nan],
[nan, nan, nan, ..., nan, nan, nan],
[nan, nan, nan, ..., nan, nan, nan]],
[[nan, nan, nan, ..., nan, nan, nan],
[nan, nan, nan, ..., nan, nan, nan],
[nan, nan, nan, ..., nan, nan, nan],
...,
[nan, nan, nan, ..., nan, nan, nan],
[nan, nan, nan, ..., nan, nan, nan],
[nan, nan, nan, ..., nan, nan, nan]]]], dtype=float32) ZDR
(time, z, y, x)
float32
nan nan nan nan ... nan nan nan nan
_FillValue : 0.0 units : dB standard_name : log_differential_reflectivity_hv Polarization : Horizontal and Vertical coordinates : time range array([[[[nan, nan, nan, ..., nan, nan, nan],
[nan, nan, nan, ..., nan, nan, nan],
[nan, nan, nan, ..., nan, nan, nan],
...,
[nan, nan, nan, ..., nan, nan, nan],
[nan, nan, nan, ..., nan, nan, nan],
[nan, nan, nan, ..., nan, nan, nan]],
[[nan, nan, nan, ..., nan, nan, nan],
[nan, nan, nan, ..., nan, nan, nan],
[nan, nan, nan, ..., nan, nan, nan],
...,
[nan, nan, nan, ..., nan, nan, nan],
[nan, nan, nan, ..., nan, nan, nan],
[nan, nan, nan, ..., nan, nan, nan]],
[[nan, nan, nan, ..., nan, nan, nan],
[nan, nan, nan, ..., nan, nan, nan],
[nan, nan, nan, ..., nan, nan, nan],
...,
...
...,
[nan, nan, nan, ..., nan, nan, nan],
[nan, nan, nan, ..., nan, nan, nan],
[nan, nan, nan, ..., nan, nan, nan]],
[[nan, nan, nan, ..., nan, nan, nan],
[nan, nan, nan, ..., nan, nan, nan],
[nan, nan, nan, ..., nan, nan, nan],
...,
[nan, nan, nan, ..., nan, nan, nan],
[nan, nan, nan, ..., nan, nan, nan],
[nan, nan, nan, ..., nan, nan, nan]],
[[nan, nan, nan, ..., nan, nan, nan],
[nan, nan, nan, ..., nan, nan, nan],
[nan, nan, nan, ..., nan, nan, nan],
...,
[nan, nan, nan, ..., nan, nan, nan],
[nan, nan, nan, ..., nan, nan, nan],
[nan, nan, nan, ..., nan, nan, nan]]]], dtype=float32) PHIDP
(time, z, y, x)
float32
nan nan nan nan ... nan nan nan nan
_FillValue : 0.0 units : degrees standard_name : differential_phase_hv Polarization : Horizontal and Vertical coordinates : time range array([[[[nan, nan, nan, ..., nan, nan, nan],
[nan, nan, nan, ..., nan, nan, nan],
[nan, nan, nan, ..., nan, nan, nan],
...,
[nan, nan, nan, ..., nan, nan, nan],
[nan, nan, nan, ..., nan, nan, nan],
[nan, nan, nan, ..., nan, nan, nan]],
[[nan, nan, nan, ..., nan, nan, nan],
[nan, nan, nan, ..., nan, nan, nan],
[nan, nan, nan, ..., nan, nan, nan],
...,
[nan, nan, nan, ..., nan, nan, nan],
[nan, nan, nan, ..., nan, nan, nan],
[nan, nan, nan, ..., nan, nan, nan]],
[[nan, nan, nan, ..., nan, nan, nan],
[nan, nan, nan, ..., nan, nan, nan],
[nan, nan, nan, ..., nan, nan, nan],
...,
...
...,
[nan, nan, nan, ..., nan, nan, nan],
[nan, nan, nan, ..., nan, nan, nan],
[nan, nan, nan, ..., nan, nan, nan]],
[[nan, nan, nan, ..., nan, nan, nan],
[nan, nan, nan, ..., nan, nan, nan],
[nan, nan, nan, ..., nan, nan, nan],
...,
[nan, nan, nan, ..., nan, nan, nan],
[nan, nan, nan, ..., nan, nan, nan],
[nan, nan, nan, ..., nan, nan, nan]],
[[nan, nan, nan, ..., nan, nan, nan],
[nan, nan, nan, ..., nan, nan, nan],
[nan, nan, nan, ..., nan, nan, nan],
...,
[nan, nan, nan, ..., nan, nan, nan],
[nan, nan, nan, ..., nan, nan, nan],
[nan, nan, nan, ..., nan, nan, nan]]]], dtype=float32) RHOHV
(time, z, y, x)
float32
nan nan nan nan ... nan nan nan nan
_FillValue : 0.0 units : standard_name : cross_correlation_ratio_hv Polarization : Horizontal and Vertical coordinates : time range array([[[[nan, nan, nan, ..., nan, nan, nan],
[nan, nan, nan, ..., nan, nan, nan],
[nan, nan, nan, ..., nan, nan, nan],
...,
[nan, nan, nan, ..., nan, nan, nan],
[nan, nan, nan, ..., nan, nan, nan],
[nan, nan, nan, ..., nan, nan, nan]],
[[nan, nan, nan, ..., nan, nan, nan],
[nan, nan, nan, ..., nan, nan, nan],
[nan, nan, nan, ..., nan, nan, nan],
...,
[nan, nan, nan, ..., nan, nan, nan],
[nan, nan, nan, ..., nan, nan, nan],
[nan, nan, nan, ..., nan, nan, nan]],
[[nan, nan, nan, ..., nan, nan, nan],
[nan, nan, nan, ..., nan, nan, nan],
[nan, nan, nan, ..., nan, nan, nan],
...,
...
...,
[nan, nan, nan, ..., nan, nan, nan],
[nan, nan, nan, ..., nan, nan, nan],
[nan, nan, nan, ..., nan, nan, nan]],
[[nan, nan, nan, ..., nan, nan, nan],
[nan, nan, nan, ..., nan, nan, nan],
[nan, nan, nan, ..., nan, nan, nan],
...,
[nan, nan, nan, ..., nan, nan, nan],
[nan, nan, nan, ..., nan, nan, nan],
[nan, nan, nan, ..., nan, nan, nan]],
[[nan, nan, nan, ..., nan, nan, nan],
[nan, nan, nan, ..., nan, nan, nan],
[nan, nan, nan, ..., nan, nan, nan],
...,
[nan, nan, nan, ..., nan, nan, nan],
[nan, nan, nan, ..., nan, nan, nan],
[nan, nan, nan, ..., nan, nan, nan]]]], dtype=float32) ROI
(time, z, y, x)
float32
9.258e+03 9.24e+03 ... 1.026e+04
standard_name : radius_of_influence long_name : Radius of influence for mapping units : m least_significant_digit : 1 _FillValue : -9999.0 array([[[[ 9258.122, 9239.624, 9221.163, ..., 9221.163, 9239.624,
9258.122],
[ 9239.624, 9221.089, 9202.592, ..., 9202.592, 9221.089,
9239.624],
[ 9221.163, 9202.592, 9184.057, ..., 9184.057, 9202.592,
9221.163],
...,
[ 9221.163, 9202.592, 9184.057, ..., 9184.057, 9202.592,
9221.163],
[ 9239.624, 9221.089, 9202.592, ..., 9202.592, 9221.089,
9239.624],
[ 9258.122, 9239.624, 9221.163, ..., 9221.163, 9239.624,
9258.122]],
[[ 9270.622, 9252.124, 9233.663, ..., 9233.663, 9252.124,
9270.622],
[ 9252.124, 9233.589, 9215.092, ..., 9215.092, 9233.589,
9252.124],
[ 9233.663, 9215.092, 9196.557, ..., 9196.557, 9215.092,
9233.663],
...
[10208.663, 10190.092, 10171.557, ..., 10171.557, 10190.092,
10208.663],
[10227.124, 10208.589, 10190.092, ..., 10190.092, 10208.589,
10227.124],
[10245.622, 10227.124, 10208.663, ..., 10208.663, 10227.124,
10245.622]],
[[10258.122, 10239.624, 10221.163, ..., 10221.163, 10239.624,
10258.122],
[10239.624, 10221.089, 10202.592, ..., 10202.592, 10221.089,
10239.624],
[10221.163, 10202.592, 10184.057, ..., 10184.057, 10202.592,
10221.163],
...,
[10221.163, 10202.592, 10184.057, ..., 10184.057, 10202.592,
10221.163],
[10239.624, 10221.089, 10202.592, ..., 10202.592, 10221.089,
10239.624],
[10258.122, 10239.624, 10221.163, ..., 10221.163, 10239.624,
10258.122]]]], dtype=float32) Indexes: (4)
PandasIndex
PandasIndex(CFTimeIndex([2019-07-11 02:31:40.055556],
dtype='object', length=1, calendar='standard', freq=None)) PandasIndex
PandasIndex(Float64Index([    0.0,   250.0,   500.0,   750.0,  1000.0,  1250.0,  1500.0,
               1750.0,  2000.0,  2250.0,  2500.0,  2750.0,  3000.0,  3250.0,
               3500.0,  3750.0,  4000.0,  4250.0,  4500.0,  4750.0,  5000.0,
               5250.0,  5500.0,  5750.0,  6000.0,  6250.0,  6500.0,  6750.0,
               7000.0,  7250.0,  7500.0,  7750.0,  8000.0,  8250.0,  8500.0,
               8750.0,  9000.0,  9250.0,  9500.0,  9750.0, 10000.0, 10250.0,
              10500.0, 10750.0, 11000.0, 11250.0, 11500.0, 11750.0, 12000.0,
              12250.0, 12500.0, 12750.0, 13000.0, 13250.0, 13500.0, 13750.0,
              14000.0, 14250.0, 14500.0, 14750.0, 15000.0, 15250.0, 15500.0,
              15750.0, 16000.0, 16250.0, 16500.0, 16750.0, 17000.0, 17250.0,
              17500.0, 17750.0, 18000.0, 18250.0, 18500.0, 18750.0, 19000.0,
              19250.0, 19500.0, 19750.0, 20000.0],
dtype='float64', name='z')) PandasIndex
PandasIndex(Float64Index([-250000.0, -249000.0, -248000.0, -247000.0, -246000.0, -245000.0,
              -244000.0, -243000.0, -242000.0, -241000.0,
              ...
               241000.0,  242000.0,  243000.0,  244000.0,  245000.0,  246000.0,
               247000.0,  248000.0,  249000.0,  250000.0],
dtype='float64', name='y', length=501)) PandasIndex
PandasIndex(Float64Index([-250000.0, -249000.0, -248000.0, -247000.0, -246000.0, -245000.0,
              -244000.0, -243000.0, -242000.0, -241000.0,
              ...
               241000.0,  242000.0,  243000.0,  244000.0,  245000.0,  246000.0,
               247000.0,  248000.0,  249000.0,  250000.0],
             dtype='float64', name='x', length=501))
Attributes: (0)
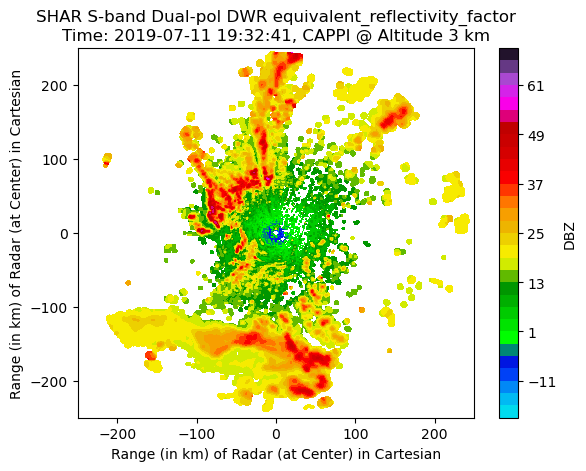
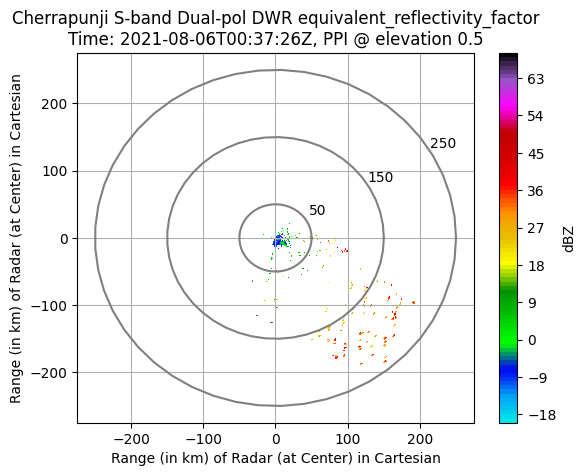
Visualization in Cartesian Plane
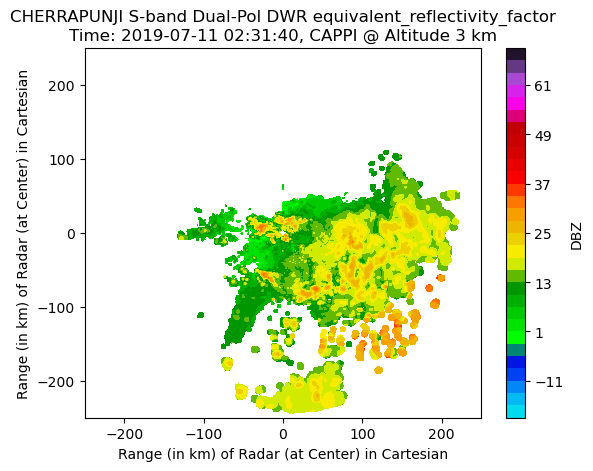
CAPPI@3km
pyiwr.visualize.cappi(xg1, altitude_level=3, field_name='DBZ', radar_location='CHERRAPUNJI', grid=False, rings=False, ticks_in_km=True, save_image=False, img_name='terlsdbz_cappi3.png')
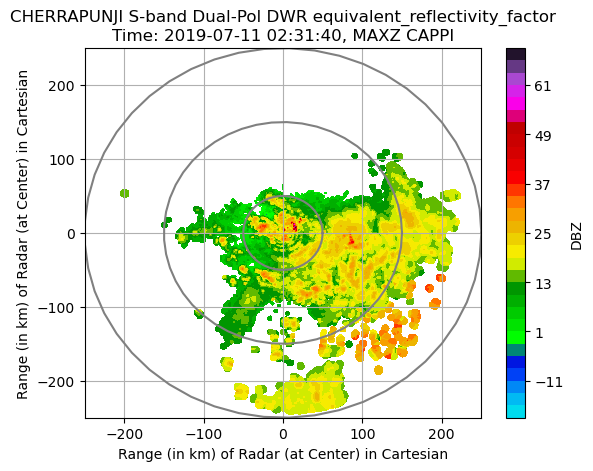
MAXZ CAPPI
pyiwr.visualize.cappi_max(xg1, field_name='DBZ ', radar_location='CHERRAPUNJI ', grid=True , rings=True ,
ticks_in_km=True , save_image=False , img_name='terlsdbz_maxcappi.png ')
Marginal Distribution of MAXZ CAPPI
pyiwr.visualize.marginal_max(xg1, radar_location='CHERRAPUNJI ', field_name='DBZ ', rings=True , grid=True ,
cross_sections=True , save_image=False , img_name='terlsdbz_margmax.png ')
Marginal Distribution of MAXZ CAPPI with background map
pyiwr.visualize .marginal_max_map (xg1, radar_location='CHERRAPUNJI' , field_name='DBZ' , background ='terrain-background' ,
cross_sections=True, save_image=False, img_name=None)
SHAR RADAR
Reading content of file and making radar object
radar2 = pyiwr.format_transform .correctednc (filenamel1, save_file=False)
radar2.info()
Processing file: RSSHR_11JUL2019_193241_L2B_STD.nc
Date Time of Mosdac File RSSHR_11JUL2019_193241_L2B_STD.nc corrected successfully
altitude:
data: <ndarray of type: float64 and shape: (1 ,)>
_FillValue: nan
units: meters
altitude_agl: None
antenna_transition: None
azimuth:
data: <ndarray of type: float32 and shape: (3960 ,)>
_FillValue: nan
standard_name: ray_azimuth_angle
units: degrees
long_name: azimuth_angle_from_true_north
axis: radial_azimuth_coordinate
elevation:
data: <ndarray of type: float32 and shape: (3960 ,)>
_FillValue: nan
standard_name: ray_elevation_angle
units: degrees
long_name: elevation_angle_from_horizontal_plane
axis: radial_azimuth_coordinate
fields:
DBZ:
data: <ndarray of type: float32 and shape: (3960 , 1600 )>
_FillValue: 0.0
units: dBZ
standard_name: equivalent_reflectivity_factor
Polarization: Horizontal
coordinates: time range
VEL:
data: <ndarray of type: float32 and shape: (3960 , 1600 )>
_FillValue: 0.0
units: m/s
standard_name: radial_velocity_of_scatterers_ away_from_instrument
Polarization: Horizontal
coordinates: time range
WIDTH:
data: <ndarray of type: float32 and shape: (3960 , 1600 )>
_FillValue: 0.0
units: m/s
standard_name: doppler_spectrum_width
Polarization: Horizontal
coordinates: time range
ZDR:
data: <ndarray of type: float32 and shape: (3960 , 1600 )>
_FillValue: 0.0
units: dB
standard_name: log_differential_reflectivity_hv
Polarization: Horizontal and Vertical
coordinates: time range
PHIDP:
data: <ndarray of type: float32 and shape: (3960 , 1600 )>
_FillValue: 0.0
units: degrees
standard_name: differential_phase_hv
Polarization: Horizontal and Vertical
coordinates: time range
RHOHV:
data: <ndarray of type: float32 and shape: (3960 , 1600 )>
_FillValue: 0.0
units:
standard_name: cross_correlation_ratio_hv
Polarization: Horizontal and Vertical
coordinates: time range
fixed_angle:
data: <ndarray of type: float32 and shape: (11 ,)>
_FillValue: nan
units: degrees
instrument_parameters: None
latitude:
data: <ndarray of type: float64 and shape: (1 ,)>
_FillValue: nan
units: degrees_north
longitude:
data: <ndarray of type: float64 and shape: (1 ,)>
_FillValue: nan
units: degrees_east
nsweeps: 11
ngates: 1600
nrays: 3960
radar_calibration: None
range:
data: <ndarray of type: float64 and shape: (1600 ,)>
_FillValue: nan
standard_name: projection_range_coordinate
long_name: range_to_measurement_volume
units: meters
spacing_is_constant: true
meters_to_center_of_first_gate: true
axis: radial_range_coordinate
scan_rate: None
scan_type: ppi
sweep_end_ray_index:
data: <ndarray of type: int64 and shape: (11 ,)>
sweep_mode:
data: <ndarray of type: |S1 and shape: (11 , 32 )>
sweep_number:
data: <ndarray of type: int32 and shape: (11 ,)>
sweep_start_ray_index:
data: <ndarray of type: int64 and shape: (11 ,)>
target_scan_rate: None
time:
data: <ndarray of type: float64 and shape: (3960 ,)>
_FillValue: nan
standard_name: time
long_name: time_in_seconds_since_volume_start
units: seconds since 2019 -07 -11 T19:32 :41
calendar: gregorian
metadata:
instrument_name: SHAR S-band Dual-pol DWR
Created using: pyiwr (Indian Weather Radar) Module developed by Researchers at SIGMA Research Lab, IIT Indore
version: Version 1.0
title: SHAR S-band DDWR data
institution: ISRO
references: Py-art_https://arm-doe.github.io/pyart/notebooks/basic_ingest_using_test_radar_object.html
source: DWR volume scan data
comment:
Conventions: CF/Radial
field_names: DBZ, VEL, WIDTH, ZDR, PHIDP, RHOHV
history: DWR mosdac files (.nc) data encoded into Py-ART compatible NetCDF file
volume_number: 0
platform_type: fixed
instrument_type: radar
primary_axis: axis_z
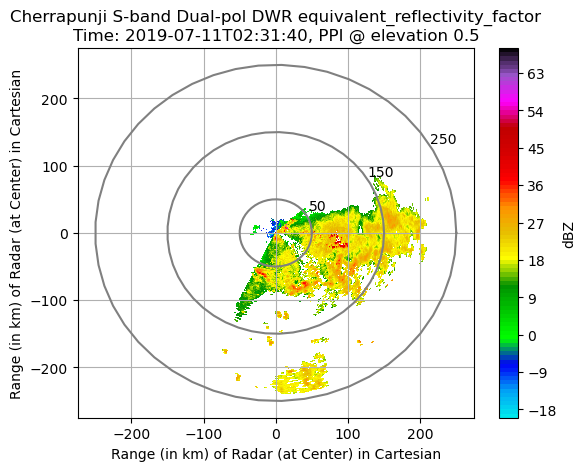
Visualization in Cartesian Plane
PPI Plot of any Radar Field at any given elevation angle
pyiwr.visualize.elevation(radar2, field_name='DBZ', elevation_index=0, rings=True, grid=True, range_in_km=True,
                                                                         save_image=False, img_name='terls_dbz0.png')
PPI Plots at all elevation angle of any Radar Field
pyiwr.visualize.all_elevation(radar2, field_name='DBZ ', rings=True , grid=True , range_in_km=True ,
save_image=False , img_name='terls_dbzall.png ')
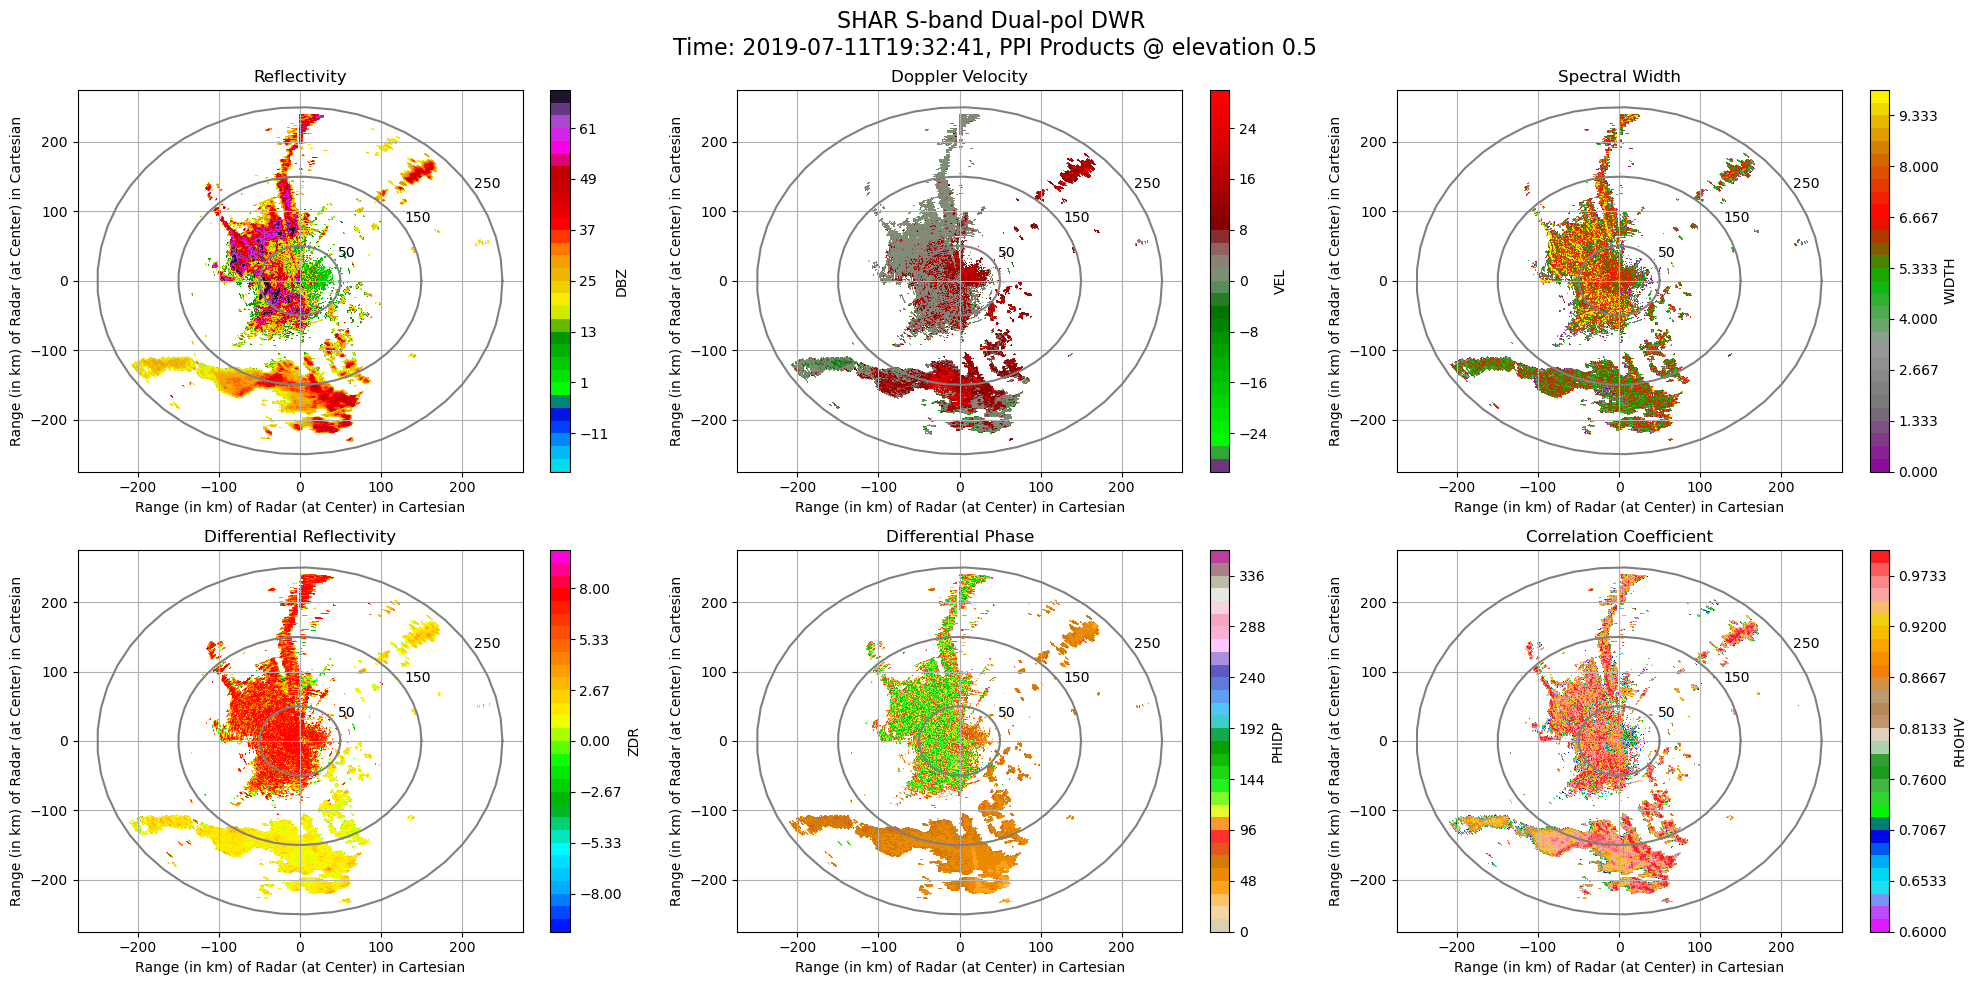
PPI Plots of all Radar Fields at any given elevation angle
pyiwr.visualize.fields_elevation(radar2, elevation_index=0, range_in_km=True, rings=True, grid=True,
                                                                     save_image=False, img_name='terls_fieldall.png')
Reading content of file and making grid object
xg2 = pyiwr.format_transform.sweeps2gridnc(filenamel1, grid_shape=(81 , 501 , 501 ), height=20 , length=250 , save_file=False)
xg2
Processing file : RSSHR_11JUL2019_193241_L2B_STD.nc
Xarray gridding of volumetric sweeps of radar PPI scan file : RSSHR_11JUL2019_193241_L2B_STD.nc done successfully
<xarray.Dataset>
Dimensions:  (time: 1, z: 81, y: 501, x: 501)
Coordinates:
   time     (time) object 2019-07-11 19:32:41.055556
   z        (z) float64 0.0 250.0 500.0 750.0 ... 1.95e+04 1.975e+04 2e+04
    lat      (y) float64 11.41 11.42 11.42 11.43 ... 15.87 15.88 15.89 15.9
    lon      (x) float64 77.93 77.94 77.95 77.96 ... 82.49 82.5 82.51 82.52
   y        (y) float64 -2.5e+05 -2.49e+05 -2.48e+05 ... 2.49e+05 2.5e+05
  * x        (x) float64 -2.5e+05 -2.49e+05 -2.48e+05 ... 2.49e+05 2.5e+05
Data variables:
    DBZ      (time, z, y, x) float32 nan nan nan nan nan ... nan nan nan nan nan
    VEL      (time, z, y, x) float32 nan nan nan nan nan ... nan nan nan nan nan
    WIDTH    (time, z, y, x) float32 nan nan nan nan nan ... nan nan nan nan nan
    ZDR      (time, z, y, x) float32 nan nan nan nan nan ... nan nan nan nan nan
    PHIDP    (time, z, y, x) float32 nan nan nan nan nan ... nan nan nan nan nan
    RHOHV    (time, z, y, x) float32 nan nan nan nan nan ... nan nan nan nan nan
ROI (time, z, y, x) float32 9.258e+03 9.24e+03 ... 1.024e+04 1.026e+04 Dimensions:
Coordinates: (6)
time
(time)
object
2019-07-11 19:32:41.055556
array([cftime.DatetimeGregorian(2019, 7, 11, 19, 32, 41, 55556, has_year_zero=False)],
      dtype=object)
z
(z)
float64
0.0 250.0 500.0 ... 1.975e+04 2e+04
standard_name : projection_z_coordinate long_name : Z distance on the projection plane from the origin axis : Z units : m positive : up array([ 0., 250., 500., 750., 1000., 1250., 1500., 1750., 2000.,
2250., 2500., 2750., 3000., 3250., 3500., 3750., 4000., 4250.,
4500., 4750., 5000., 5250., 5500., 5750., 6000., 6250., 6500.,
6750., 7000., 7250., 7500., 7750., 8000., 8250., 8500., 8750.,
9000., 9250., 9500., 9750., 10000., 10250., 10500., 10750., 11000.,
11250., 11500., 11750., 12000., 12250., 12500., 12750., 13000., 13250.,
13500., 13750., 14000., 14250., 14500., 14750., 15000., 15250., 15500.,
15750., 16000., 16250., 16500., 16750., 17000., 17250., 17500., 17750.,
18000., 18250., 18500., 18750., 19000., 19250., 19500., 19750., 20000.]) lat
(y)
float64
11.41 11.42 11.42 ... 15.89 15.9
long_name : latitude of grid cell center units : degree_N standard_name : Latitude array([11.40613983, 11.41513042, 11.42412102, 11.43311161, 11.4421022 ,
11.45109279, 11.46008338, 11.46907398, 11.47806457, 11.48705516,
11.49604575, 11.50503634, 11.51402693, 11.52301752, 11.5320081 ,
11.54099869, 11.54998928, 11.55897987, 11.56797046, 11.57696104,
11.58595163, 11.59494222, 11.6039328 , 11.61292339, 11.62191397,
11.63090456, 11.63989514, 11.64888573, 11.65787631, 11.6668669 ,
11.67585748, 11.68484806, 11.69383864, 11.70282923, 11.71181981,
11.72081039, 11.72980097, 11.73879155, 11.74778213, 11.75677271,
11.76576329, 11.77475387, 11.78374445, 11.79273503, 11.80172561,
11.81071619, 11.81970677, 11.82869734, 11.83768792, 11.8466785 ,
11.85566907, 11.86465965, 11.87365023, 11.8826408 , 11.89163138,
11.90062195, 11.90961253, 11.9186031 , 11.92759367, 11.93658425,
11.94557482, 11.95456539, 11.96355597, 11.97254654, 11.98153711,
11.99052768, 11.99951825, 12.00850882, 12.01749939, 12.02648996,
12.03548053, 12.0444711 , 12.05346167, 12.06245224, 12.07144281,
12.08043337, 12.08942394, 12.09841451, 12.10740508, 12.11639564,
12.12538621, 12.13437677, 12.14336734, 12.1523579 , 12.16134847,
12.17033903, 12.1793296 , 12.18832016, 12.19731072, 12.20630129,
12.21529185, 12.22428241, 12.23327297, 12.24226354, 12.2512541 ,
12.26024466, 12.26923522, 12.27822578, 12.28721634, 12.2962069 ,
...
15.04730053, 15.05629097, 15.06528141, 15.07427185, 15.08326229,
15.09225273, 15.10124317, 15.11023361, 15.11922405, 15.12821449,
15.13720492, 15.14619536, 15.1551858 , 15.16417623, 15.17316667,
15.18215711, 15.19114754, 15.20013798, 15.20912841, 15.21811884,
15.22710928, 15.23609971, 15.24509014, 15.25408058, 15.26307101,
15.27206144, 15.28105187, 15.2900423 , 15.29903273, 15.30802316,
15.31701359, 15.32600402, 15.33499445, 15.34398488, 15.3529753 ,
15.36196573, 15.37095616, 15.37994659, 15.38893701, 15.39792744,
15.40691786, 15.41590829, 15.42489871, 15.43388913, 15.44287956,
15.45186998, 15.4608604 , 15.46985083, 15.47884125, 15.48783167,
15.49682209, 15.50581251, 15.51480293, 15.52379335, 15.53278377,
15.54177419, 15.55076461, 15.55975503, 15.56874544, 15.57773586,
15.58672628, 15.59571669, 15.60470711, 15.61369752, 15.62268794,
15.63167835, 15.64066877, 15.64965918, 15.65864959, 15.66764001,
15.67663042, 15.68562083, 15.69461124, 15.70360165, 15.71259206,
15.72158247, 15.73057288, 15.73956329, 15.7485537 , 15.75754411,
15.76653452, 15.77552493, 15.78451533, 15.79350574, 15.80249615,
15.81148655, 15.82047696, 15.82946736, 15.83845777, 15.84744817,
15.85643858, 15.86542898, 15.87441938, 15.88340978, 15.89240019,
15.90139059]) lon
(x)
float64
77.93 77.94 77.95 ... 82.51 82.52
long_name : longitude of grid cell center units : degree_E standard_name : Longitude array([77.9343612 , 77.9435329 , 77.9527046 , 77.96187631, 77.97104802,
77.98021974, 77.98939147, 77.9985632 , 78.00773493, 78.01690667,
78.02607842, 78.03525017, 78.04442193, 78.05359369, 78.06276546,
78.07193723, 78.081109 , 78.09028079, 78.09945257, 78.10862437,
78.11779617, 78.12696797, 78.13613978, 78.14531159, 78.15448341,
78.16365523, 78.17282706, 78.18199889, 78.19117073, 78.20034257,
78.20951442, 78.21868627, 78.22785813, 78.23702999, 78.24620186,
78.25537373, 78.26454561, 78.27371749, 78.28288938, 78.29206127,
78.30123316, 78.31040506, 78.31957697, 78.32874888, 78.33792079,
78.34709271, 78.35626463, 78.36543656, 78.37460849, 78.38378043,
78.39295237, 78.40212431, 78.41129626, 78.42046822, 78.42964018,
78.43881214, 78.44798411, 78.45715608, 78.46632805, 78.47550003,
78.48467202, 78.49384401, 78.503016 , 78.512188 , 78.52136 ,
78.530532 , 78.53970401, 78.54887602, 78.55804804, 78.56722006,
78.57639209, 78.58556412, 78.59473615, 78.60390819, 78.61308023,
78.62225227, 78.63142432, 78.64059637, 78.64976843, 78.65894049,
78.66811255, 78.67728462, 78.68645669, 78.69562877, 78.70480085,
78.71397293, 78.72314502, 78.73231711, 78.7414892 , 78.7506613 ,
78.7598334 , 78.7690055 , 78.77817761, 78.78734972, 78.79652183,
78.80569395, 78.81486607, 78.8240382 , 78.83321033, 78.84238246,
...
81.64910605, 81.65827817, 81.66745028, 81.67662239, 81.6857945 ,
81.6949666 , 81.7041387 , 81.7133108 , 81.72248289, 81.73165498,
81.74082707, 81.74999915, 81.75917123, 81.76834331, 81.77751538,
81.78668745, 81.79585951, 81.80503157, 81.81420363, 81.82337568,
81.83254773, 81.84171977, 81.85089181, 81.86006385, 81.86923588,
81.87840791, 81.88757994, 81.89675196, 81.90592398, 81.91509599,
81.924268 , 81.93344 , 81.942612 , 81.951784 , 81.96095599,
81.97012798, 81.97929997, 81.98847195, 81.99764392, 82.00681589,
82.01598786, 82.02515982, 82.03433178, 82.04350374, 82.05267569,
82.06184763, 82.07101957, 82.08019151, 82.08936344, 82.09853537,
82.10770729, 82.11687921, 82.12605112, 82.13522303, 82.14439494,
82.15356684, 82.16273873, 82.17191062, 82.18108251, 82.19025439,
82.19942627, 82.20859814, 82.21777001, 82.22694187, 82.23611373,
82.24528558, 82.25445743, 82.26362927, 82.27280111, 82.28197294,
82.29114477, 82.30031659, 82.30948841, 82.31866022, 82.32783203,
82.33700383, 82.34617563, 82.35534743, 82.36451921, 82.373691 ,
82.38286277, 82.39203454, 82.40120631, 82.41037807, 82.41954983,
82.42872158, 82.43789333, 82.44706507, 82.4562368 , 82.46540853,
82.47458026, 82.48375198, 82.49292369, 82.5020954 , 82.5112671 ,
82.5204388 ]) y
(y)
float64
-2.5e+05 -2.49e+05 ... 2.5e+05
standard_name : projection_y_coordinate long_name : Y distance on the projection plane from the origin axis : Y units : m array([-250000., -249000., -248000., ..., 248000., 249000., 250000.]) x
(x)
float64
-2.5e+05 -2.49e+05 ... 2.5e+05
standard_name : projection_x_coordinate long_name : X distance on the projection plane from the origin axis : X units : m array([-250000., -249000., -248000., ..., 248000., 249000., 250000.]) Data variables: (7)
DBZ
(time, z, y, x)
float32
nan nan nan nan ... nan nan nan nan
_FillValue : 0.0 units : dBZ standard_name : equivalent_reflectivity_factor Polarization : Horizontal coordinates : time range array([[[[nan, nan, nan, ..., nan, nan, nan],
[nan, nan, nan, ..., nan, nan, nan],
[nan, nan, nan, ..., nan, nan, nan],
...,
[nan, nan, nan, ..., nan, nan, nan],
[nan, nan, nan, ..., nan, nan, nan],
[nan, nan, nan, ..., nan, nan, nan]],
[[nan, nan, nan, ..., nan, nan, nan],
[nan, nan, nan, ..., nan, nan, nan],
[nan, nan, nan, ..., nan, nan, nan],
...,
[nan, nan, nan, ..., nan, nan, nan],
[nan, nan, nan, ..., nan, nan, nan],
[nan, nan, nan, ..., nan, nan, nan]],
[[nan, nan, nan, ..., nan, nan, nan],
[nan, nan, nan, ..., nan, nan, nan],
[nan, nan, nan, ..., nan, nan, nan],
...,
...
...,
[nan, nan, nan, ..., nan, nan, nan],
[nan, nan, nan, ..., nan, nan, nan],
[nan, nan, nan, ..., nan, nan, nan]],
[[nan, nan, nan, ..., nan, nan, nan],
[nan, nan, nan, ..., nan, nan, nan],
[nan, nan, nan, ..., nan, nan, nan],
...,
[nan, nan, nan, ..., nan, nan, nan],
[nan, nan, nan, ..., nan, nan, nan],
[nan, nan, nan, ..., nan, nan, nan]],
[[nan, nan, nan, ..., nan, nan, nan],
[nan, nan, nan, ..., nan, nan, nan],
[nan, nan, nan, ..., nan, nan, nan],
...,
[nan, nan, nan, ..., nan, nan, nan],
[nan, nan, nan, ..., nan, nan, nan],
[nan, nan, nan, ..., nan, nan, nan]]]], dtype=float32) VEL
(time, z, y, x)
float32
nan nan nan nan ... nan nan nan nan
_FillValue : 0.0 units : m/s standard_name : radial_velocity_ofscatterers away_from_instrument Polarization : Horizontal coordinates : time range array([[[[nan, nan, nan, ..., nan, nan, nan],
[nan, nan, nan, ..., nan, nan, nan],
[nan, nan, nan, ..., nan, nan, nan],
...,
[nan, nan, nan, ..., nan, nan, nan],
[nan, nan, nan, ..., nan, nan, nan],
[nan, nan, nan, ..., nan, nan, nan]],
[[nan, nan, nan, ..., nan, nan, nan],
[nan, nan, nan, ..., nan, nan, nan],
[nan, nan, nan, ..., nan, nan, nan],
...,
[nan, nan, nan, ..., nan, nan, nan],
[nan, nan, nan, ..., nan, nan, nan],
[nan, nan, nan, ..., nan, nan, nan]],
[[nan, nan, nan, ..., nan, nan, nan],
[nan, nan, nan, ..., nan, nan, nan],
[nan, nan, nan, ..., nan, nan, nan],
...,
...
...,
[nan, nan, nan, ..., nan, nan, nan],
[nan, nan, nan, ..., nan, nan, nan],
[nan, nan, nan, ..., nan, nan, nan]],
[[nan, nan, nan, ..., nan, nan, nan],
[nan, nan, nan, ..., nan, nan, nan],
[nan, nan, nan, ..., nan, nan, nan],
...,
[nan, nan, nan, ..., nan, nan, nan],
[nan, nan, nan, ..., nan, nan, nan],
[nan, nan, nan, ..., nan, nan, nan]],
[[nan, nan, nan, ..., nan, nan, nan],
[nan, nan, nan, ..., nan, nan, nan],
[nan, nan, nan, ..., nan, nan, nan],
...,
[nan, nan, nan, ..., nan, nan, nan],
[nan, nan, nan, ..., nan, nan, nan],
[nan, nan, nan, ..., nan, nan, nan]]]], dtype=float32) WIDTH
(time, z, y, x)
float32
nan nan nan nan ... nan nan nan nan
_FillValue : 0.0 units : m/s standard_name : doppler_spectrum_width Polarization : Horizontal coordinates : time range array([[[[nan, nan, nan, ..., nan, nan, nan],
[nan, nan, nan, ..., nan, nan, nan],
[nan, nan, nan, ..., nan, nan, nan],
...,
[nan, nan, nan, ..., nan, nan, nan],
[nan, nan, nan, ..., nan, nan, nan],
[nan, nan, nan, ..., nan, nan, nan]],
[[nan, nan, nan, ..., nan, nan, nan],
[nan, nan, nan, ..., nan, nan, nan],
[nan, nan, nan, ..., nan, nan, nan],
...,
[nan, nan, nan, ..., nan, nan, nan],
[nan, nan, nan, ..., nan, nan, nan],
[nan, nan, nan, ..., nan, nan, nan]],
[[nan, nan, nan, ..., nan, nan, nan],
[nan, nan, nan, ..., nan, nan, nan],
[nan, nan, nan, ..., nan, nan, nan],
...,
...
...,
[nan, nan, nan, ..., nan, nan, nan],
[nan, nan, nan, ..., nan, nan, nan],
[nan, nan, nan, ..., nan, nan, nan]],
[[nan, nan, nan, ..., nan, nan, nan],
[nan, nan, nan, ..., nan, nan, nan],
[nan, nan, nan, ..., nan, nan, nan],
...,
[nan, nan, nan, ..., nan, nan, nan],
[nan, nan, nan, ..., nan, nan, nan],
[nan, nan, nan, ..., nan, nan, nan]],
[[nan, nan, nan, ..., nan, nan, nan],
[nan, nan, nan, ..., nan, nan, nan],
[nan, nan, nan, ..., nan, nan, nan],
...,
[nan, nan, nan, ..., nan, nan, nan],
[nan, nan, nan, ..., nan, nan, nan],
[nan, nan, nan, ..., nan, nan, nan]]]], dtype=float32) ZDR
(time, z, y, x)
float32
nan nan nan nan ... nan nan nan nan
_FillValue : 0.0 units : dB standard_name : log_differential_reflectivity_hv Polarization : Horizontal and Vertical coordinates : time range array([[[[nan, nan, nan, ..., nan, nan, nan],
[nan, nan, nan, ..., nan, nan, nan],
[nan, nan, nan, ..., nan, nan, nan],
...,
[nan, nan, nan, ..., nan, nan, nan],
[nan, nan, nan, ..., nan, nan, nan],
[nan, nan, nan, ..., nan, nan, nan]],
[[nan, nan, nan, ..., nan, nan, nan],
[nan, nan, nan, ..., nan, nan, nan],
[nan, nan, nan, ..., nan, nan, nan],
...,
[nan, nan, nan, ..., nan, nan, nan],
[nan, nan, nan, ..., nan, nan, nan],
[nan, nan, nan, ..., nan, nan, nan]],
[[nan, nan, nan, ..., nan, nan, nan],
[nan, nan, nan, ..., nan, nan, nan],
[nan, nan, nan, ..., nan, nan, nan],
...,
...
...,
[nan, nan, nan, ..., nan, nan, nan],
[nan, nan, nan, ..., nan, nan, nan],
[nan, nan, nan, ..., nan, nan, nan]],
[[nan, nan, nan, ..., nan, nan, nan],
[nan, nan, nan, ..., nan, nan, nan],
[nan, nan, nan, ..., nan, nan, nan],
...,
[nan, nan, nan, ..., nan, nan, nan],
[nan, nan, nan, ..., nan, nan, nan],
[nan, nan, nan, ..., nan, nan, nan]],
[[nan, nan, nan, ..., nan, nan, nan],
[nan, nan, nan, ..., nan, nan, nan],
[nan, nan, nan, ..., nan, nan, nan],
...,
[nan, nan, nan, ..., nan, nan, nan],
[nan, nan, nan, ..., nan, nan, nan],
[nan, nan, nan, ..., nan, nan, nan]]]], dtype=float32) PHIDP
(time, z, y, x)
float32
nan nan nan nan ... nan nan nan nan
_FillValue : 0.0 units : degrees standard_name : differential_phase_hv Polarization : Horizontal and Vertical coordinates : time range array([[[[nan, nan, nan, ..., nan, nan, nan],
[nan, nan, nan, ..., nan, nan, nan],
[nan, nan, nan, ..., nan, nan, nan],
...,
[nan, nan, nan, ..., nan, nan, nan],
[nan, nan, nan, ..., nan, nan, nan],
[nan, nan, nan, ..., nan, nan, nan]],
[[nan, nan, nan, ..., nan, nan, nan],
[nan, nan, nan, ..., nan, nan, nan],
[nan, nan, nan, ..., nan, nan, nan],
...,
[nan, nan, nan, ..., nan, nan, nan],
[nan, nan, nan, ..., nan, nan, nan],
[nan, nan, nan, ..., nan, nan, nan]],
[[nan, nan, nan, ..., nan, nan, nan],
[nan, nan, nan, ..., nan, nan, nan],
[nan, nan, nan, ..., nan, nan, nan],
...,
...
...,
[nan, nan, nan, ..., nan, nan, nan],
[nan, nan, nan, ..., nan, nan, nan],
[nan, nan, nan, ..., nan, nan, nan]],
[[nan, nan, nan, ..., nan, nan, nan],
[nan, nan, nan, ..., nan, nan, nan],
[nan, nan, nan, ..., nan, nan, nan],
...,
[nan, nan, nan, ..., nan, nan, nan],
[nan, nan, nan, ..., nan, nan, nan],
[nan, nan, nan, ..., nan, nan, nan]],
[[nan, nan, nan, ..., nan, nan, nan],
[nan, nan, nan, ..., nan, nan, nan],
[nan, nan, nan, ..., nan, nan, nan],
...,
[nan, nan, nan, ..., nan, nan, nan],
[nan, nan, nan, ..., nan, nan, nan],
[nan, nan, nan, ..., nan, nan, nan]]]], dtype=float32) RHOHV
(time, z, y, x)
float32
nan nan nan nan ... nan nan nan nan
_FillValue : 0.0 units : standard_name : cross_correlation_ratio_hv Polarization : Horizontal and Vertical coordinates : time range array([[[[nan, nan, nan, ..., nan, nan, nan],
[nan, nan, nan, ..., nan, nan, nan],
[nan, nan, nan, ..., nan, nan, nan],
...,
[nan, nan, nan, ..., nan, nan, nan],
[nan, nan, nan, ..., nan, nan, nan],
[nan, nan, nan, ..., nan, nan, nan]],
[[nan, nan, nan, ..., nan, nan, nan],
[nan, nan, nan, ..., nan, nan, nan],
[nan, nan, nan, ..., nan, nan, nan],
...,
[nan, nan, nan, ..., nan, nan, nan],
[nan, nan, nan, ..., nan, nan, nan],
[nan, nan, nan, ..., nan, nan, nan]],
[[nan, nan, nan, ..., nan, nan, nan],
[nan, nan, nan, ..., nan, nan, nan],
[nan, nan, nan, ..., nan, nan, nan],
...,
...
...,
[nan, nan, nan, ..., nan, nan, nan],
[nan, nan, nan, ..., nan, nan, nan],
[nan, nan, nan, ..., nan, nan, nan]],
[[nan, nan, nan, ..., nan, nan, nan],
[nan, nan, nan, ..., nan, nan, nan],
[nan, nan, nan, ..., nan, nan, nan],
...,
[nan, nan, nan, ..., nan, nan, nan],
[nan, nan, nan, ..., nan, nan, nan],
[nan, nan, nan, ..., nan, nan, nan]],
[[nan, nan, nan, ..., nan, nan, nan],
[nan, nan, nan, ..., nan, nan, nan],
[nan, nan, nan, ..., nan, nan, nan],
...,
[nan, nan, nan, ..., nan, nan, nan],
[nan, nan, nan, ..., nan, nan, nan],
[nan, nan, nan, ..., nan, nan, nan]]]], dtype=float32) ROI
(time, z, y, x)
float32
9.258e+03 9.24e+03 ... 1.026e+04
standard_name : radius_of_influence long_name : Radius of influence for mapping units : m least_significant_digit : 1 _FillValue : -9999.0 array([[[[ 9258.122, 9239.624, 9221.163, ..., 9221.163, 9239.624,
9258.122],
[ 9239.624, 9221.089, 9202.592, ..., 9202.592, 9221.089,
9239.624],
[ 9221.163, 9202.592, 9184.057, ..., 9184.057, 9202.592,
9221.163],
...,
[ 9221.163, 9202.592, 9184.057, ..., 9184.057, 9202.592,
9221.163],
[ 9239.624, 9221.089, 9202.592, ..., 9202.592, 9221.089,
9239.624],
[ 9258.122, 9239.624, 9221.163, ..., 9221.163, 9239.624,
9258.122]],
[[ 9270.622, 9252.124, 9233.663, ..., 9233.663, 9252.124,
9270.622],
[ 9252.124, 9233.589, 9215.092, ..., 9215.092, 9233.589,
9252.124],
[ 9233.663, 9215.092, 9196.557, ..., 9196.557, 9215.092,
9233.663],
...
[10208.663, 10190.092, 10171.557, ..., 10171.557, 10190.092,
10208.663],
[10227.124, 10208.589, 10190.092, ..., 10190.092, 10208.589,
10227.124],
[10245.622, 10227.124, 10208.663, ..., 10208.663, 10227.124,
10245.622]],
[[10258.122, 10239.624, 10221.163, ..., 10221.163, 10239.624,
10258.122],
[10239.624, 10221.089, 10202.592, ..., 10202.592, 10221.089,
10239.624],
[10221.163, 10202.592, 10184.057, ..., 10184.057, 10202.592,
10221.163],
...,
[10221.163, 10202.592, 10184.057, ..., 10184.057, 10202.592,
10221.163],
[10239.624, 10221.089, 10202.592, ..., 10202.592, 10221.089,
10239.624],
[10258.122, 10239.624, 10221.163, ..., 10221.163, 10239.624,
10258.122]]]], dtype=float32) Indexes: (4)
PandasIndex
PandasIndex(CFTimeIndex([2019-07-11 19:32:41.055556],
dtype='object', length=1, calendar='standard', freq=None)) PandasIndex
PandasIndex(Float64Index([    0.0,   250.0,   500.0,   750.0,  1000.0,  1250.0,  1500.0,
               1750.0,  2000.0,  2250.0,  2500.0,  2750.0,  3000.0,  3250.0,
               3500.0,  3750.0,  4000.0,  4250.0,  4500.0,  4750.0,  5000.0,
               5250.0,  5500.0,  5750.0,  6000.0,  6250.0,  6500.0,  6750.0,
               7000.0,  7250.0,  7500.0,  7750.0,  8000.0,  8250.0,  8500.0,
               8750.0,  9000.0,  9250.0,  9500.0,  9750.0, 10000.0, 10250.0,
              10500.0, 10750.0, 11000.0, 11250.0, 11500.0, 11750.0, 12000.0,
              12250.0, 12500.0, 12750.0, 13000.0, 13250.0, 13500.0, 13750.0,
              14000.0, 14250.0, 14500.0, 14750.0, 15000.0, 15250.0, 15500.0,
              15750.0, 16000.0, 16250.0, 16500.0, 16750.0, 17000.0, 17250.0,
              17500.0, 17750.0, 18000.0, 18250.0, 18500.0, 18750.0, 19000.0,
              19250.0, 19500.0, 19750.0, 20000.0],
dtype='float64', name='z')) PandasIndex
PandasIndex(Float64Index([-250000.0, -249000.0, -248000.0, -247000.0, -246000.0, -245000.0,
              -244000.0, -243000.0, -242000.0, -241000.0,
              ...
               241000.0,  242000.0,  243000.0,  244000.0,  245000.0,  246000.0,
               247000.0,  248000.0,  249000.0,  250000.0],
dtype='float64', name='y', length=501)) PandasIndex
PandasIndex(Float64Index([-250000.0, -249000.0, -248000.0, -247000.0, -246000.0, -245000.0,
              -244000.0, -243000.0, -242000.0, -241000.0,
              ...
               241000.0,  242000.0,  243000.0,  244000.0,  245000.0,  246000.0,
               247000.0,  248000.0,  249000.0,  250000.0],
             dtype='float64', name='x', length=501))
Attributes: (0)
Visualization in Cartesian Plane
CAPPI@3km
pyiwr.visualize.cappi(xg2, altitude_level=3, field_name='DBZ', radar_location='SHAR', grid=False, rings=False,
                                                                         ticks_in_km=True, save_image=False, img_name='terlsdbz_cappi3.png')
MAXZ CAPPI
pyiwr.visualize.cappi_max(xg2, field_name='DBZ ', radar_location='SHAR ', grid=True , rings=True , ticks_in_km=True ,
save_image=False , img_name='terlsdbz_maxcappi.png ')
Marginal Distribution of MAXZ CAPPI
pyiwr.visualize.marginal_max(xg2, radar_location='SHAR ', field_name='DBZ ', rings=True , grid=True , cross_sections=True ,
save_image=False , img_name='terlsdbz_margmax.png ')
Marginal Distribution of MAXZ CAPPI with background map
pyiwr.visualize .marginal_max_map (xg2, radar_location='SHAR' , field_name='DBZ' , background ='terrain-background' ,
cross_sections=True, save_image=False, img_name=None)
THANK YOU
Skip to main content
PYIWR
Importing the pyiwr Library
## You are using the Python ARM Radar Toolkit (Py-ART), an open source
## library for working with weather radar data. Py-ART is partly
## supported by the U.S. Department of Energy as part of the Atmospheric
## Radiation Measurement (ARM) Climate Research Facility, an Office of
## Science user facility.
##
## If you use this software to prepare a publication, please cite:
##
##     JJ Helmus and SM Collis, JORS 2016, doi: 10.5334/jors.119
File location
= '/media/sigma/Backup Plus/Nitig/radar/Nitig_data/rawdwr/Files/cherrapunjee_weather_2021_08_06_00_37_26_dsfisro6n.dwr'
= 'cherrapunjee_weather_2021_08_06_00_37_26_dsfisro6n.dwr'
= pyiwr.format_transform.raw2nc (filename, save_file = True )
Processing file: cherrapunjee_weather_2021_08_06_00_37_26_dsfisro6n.dwr
File cherrapunjee_weather_2021_08_06_00_37_26_dsfisro6n.dwr converted successfully and saved in the "radar_ncfiles" folder
altitude:
	data: <ndarray of type: int32 and shape: (1,)>
	long_name: Altitude
	units: meters
	standard_name: Altitude
	positive: up
altitude_agl: None
antenna_transition:
	data: <ndarray of type: float64 and shape: (3600,)>
azimuth:
	data: <ndarray of type: float32 and shape: (3600,)>
	long_name: azimuth_angle_from_true_north
	units: degrees
	standard_name: beam_azimuth_angle
	axis: radial_azimuth_coordinate
	comment: Azimuth of antenna relative to true north
elevation:
	data: <ndarray of type: float64 and shape: (3600,)>
	long_name: elevation_angle_from_horizontal_plane
	units: degrees
	standard_name: beam_elevation_angle
	axis: radial_elevation_coordinate
	comment: Elevation of antenna relative to the horizontal plane
fields:
	DBZ:
		data: <ndarray of type: float32 and shape: (3600, 1600)>
		_FillValue: nan
		units: dBZ
		standard_name: equivalent_reflectivity_factor
		Polarization: Horizontal
	VEL:
		data: <ndarray of type: float32 and shape: (3600, 1600)>
		_FillValue: nan
		units: m/s
		standard_name: radial_velocity_of_scatterers_away_from_instrument
		Polarization: Horizontal
	WIDTH:
		data: <ndarray of type: float32 and shape: (3600, 1600)>
		_FillValue: nan
		units: m/s
		standard_name: doppler_spectrum_width
		Polarization: Horizontal
	ZDR:
		data: <ndarray of type: float32 and shape: (3600, 1600)>
		_FillValue: nan
		units: dB
		standard_name: log_differential_reflectivity_hv
		Polarization: Horizontal and Vertical
	PHIDP:
		data: <ndarray of type: float32 and shape: (3600, 1600)>
		_FillValue: nan
		units: degrees
		standard_name: differential_phase_hv
		Polarization: Horizontal and Vertical
	RHOHV:
		data: <ndarray of type: float32 and shape: (3600, 1600)>
		_FillValue: nan
		units: unitless
		standard_name: cross_correlation_ratio_hv
		Polarization: Horizontal and Vertical
fixed_angle:
	data: <ndarray of type: float32 and shape: (10,)>
	long_name: Target angle for sweep
	units: degrees
	standard_name: target_fixed_angle
instrument_parameters: None
latitude:
	data: <ndarray of type: float64 and shape: (1,)>
	long_name: Latitude
	units: degrees_north
	standard_name: Latitude
longitude:
	data: <ndarray of type: float64 and shape: (1,)>
	long_name: Longitude
	units: degrees_east
	standard_name: Longitude
nsweeps: 10
ngates: 1600
nrays: 3600
radar_calibration: None
range:
	data: <ndarray of type: float64 and shape: (1600,)>
	long_name: range_to_measurement_volume
	units: meters
	standard_name: projection_range_coordinate
	axis: radial_range_coordinate
	spacing_is_constant: true
	comment: Coordinate variable for range. Range to center of each bin.
scan_rate: None
scan_type: ppi
sweep_end_ray_index:
	data: <ndarray of type: int64 and shape: (10,)>
	long_name: Index of last ray in sweep, 0-based
	units: count
sweep_mode:
	data: <ndarray of type: |S1 and shape: (10, 32)>
	long_name: Sweep mode
	units: unitless
	standard_name: sweep_mode
	comment: Options are: "sector", "coplane", "rhi", "vertical_pointing", "idle", "azimuth_surveillance", "elevation_surveillance", "sunscan", "pointing", "manual_ppi", "manual_rhi"
sweep_number:
	data: <ndarray of type: int64 and shape: (10,)>
	long_name: Sweep number
	units: count
	standard_name: sweep_number
sweep_start_ray_index:
	data: <ndarray of type: int64 and shape: (10,)>
	long_name: Index of first ray in sweep, 0-based
	units: count
target_scan_rate: None
time:
	data: <ndarray of type: float64 and shape: (3600,)>
	long_name: time_in_seconds_since_volume_start
	units: seconds since 2021-08-06T00:37:26Z
	standard_name: time
	calendar: gregorian
metadata:
	instrument_name: Cherrapunji S-band Dual-pol DWR
	Created using: pyiwr (Indian Weather Radar Toolkit) Module developed at SIGMA Research Lab, IIT Indore
	version: Version 1.0.0
	title: Cherrapunji S-band Dual-pol DWR data
	institution: ISRO
	references: Py-art_https://arm-doe.github.io/pyart/notebooks/basic_ingest_using_test_radar_object.html
	source: DWR Short Volume Scan File (250km)
	comment:
	Conventions: CF/Radial
	history: DWR raw (6n.dwr) data file encoded into Py-ART compatible NetCDF file
	field_names: DBZ, VEL, WIDTH, ZDR, PHIDP, RHOHV
	volume_number: 0
	platform_type: fixed
	instrument_type: radar
	primary_axis: axis_z
Visualizations
For PPI at specific
elevation
= 'DBZ' , elevation_index= 0 , rings= True , grid= True ,= True , save_image= False , img_name= 'img.png' )
For PPI of any field at
all elevation
= 'DBZ' , rings= True , grid= True , range_in_km= True ,= False , img_name= 'img.png' )
For PPI of all fields
= 0 , range_in_km= True , rings= True , grid= True ,= False , img_name= 'img.png' )
For
open source nc files needing correction or restructuring
File location
= '/media/sigma/Backup Plus/Nitig/radar/Nitig_data/NC FILES/sweep10/RSCHR_02APR2022_133109_L2B_STD.nc'
#For mosdac nc files = pyiwr.format_transform.correctednc (filename, save_file = False )
Processing file:  RSCHR_02APR2022_133109_L2B_STD.nc
File RSCHR_02APR2022_133109_L2B_STD.nc corrected and restructured successfully
altitude:
	data: <ndarray of type: float64 and shape: (1,)>
	_FillValue: nan
	units: meters
altitude_agl: None
antenna_transition: None
azimuth:
	data: <ndarray of type: float32 and shape: (3600,)>
	_FillValue: nan
	standard_name: ray_azimuth_angle
	units: degrees
	long_name: azimuth_angle_from_true_north
	axis: radial_azimuth_coordinate
elevation:
	data: <ndarray of type: float32 and shape: (3600,)>
	_FillValue: nan
	standard_name: ray_elevation_angle
	units: degrees
	long_name: elevation_angle_from_horizontal_plane
	axis: radial_azimuth_coordinate
fields:
	DBZ:
		data: <ndarray of type: float32 and shape: (3600, 1600)>
		_FillValue: 0.0
		units: dBZ
		standard_name: equivalent_reflectivity_factor
		Polarization: Horizontal
		coordinates: time range
	VEL:
		data: <ndarray of type: float32 and shape: (3600, 1600)>
		_FillValue: 0.0
		units: m/s
		standard_name: radial_velocity_of_scatterers_ away_from_instrument
		Polarization: Horizontal
		coordinates: time range
	WIDTH:
		data: <ndarray of type: float32 and shape: (3600, 1600)>
		_FillValue: 0.0
		units: m/s
		standard_name: doppler_spectrum_width
		Polarization: Horizontal
		coordinates: time range
	ZDR:
		data: <ndarray of type: float32 and shape: (3600, 1600)>
		_FillValue: 0.0
		units: dB
		standard_name: log_differential_reflectivity_hv
		Polarization: Horizontal and Vertical
		coordinates: time range
	PHIDP:
		data: <ndarray of type: float32 and shape: (3600, 1600)>
		_FillValue: 0.0
		units: degrees
		standard_name: differential_phase_hv
		Polarization: Horizontal and Vertical
		coordinates: time range
	RHOHV:
		data: <ndarray of type: float32 and shape: (3600, 1600)>
		_FillValue: 0.0
		units:
		standard_name: cross_correlation_ratio_hv
		Polarization: Horizontal and Vertical
		coordinates: time range
fixed_angle:
	data: <ndarray of type: float32 and shape: (10,)>
	_FillValue: nan
	units: degrees
instrument_parameters: None
latitude:
	data: <ndarray of type: float64 and shape: (1,)>
	_FillValue: nan
	units: degrees_north
longitude:
	data: <ndarray of type: float64 and shape: (1,)>
	_FillValue: nan
	units: degrees_east
nsweeps: 10
ngates: 1600
nrays: 3600
radar_calibration: None
range:
	data: <ndarray of type: float64 and shape: (1600,)>
	_FillValue: nan
	standard_name: projection_range_coordinate
	long_name: range_to_measurement_volume
	units: meters
	spacing_is_constant: true
	meters_to_center_of_first_gate: true
	axis: radial_range_coordinate
scan_rate: None
scan_type: ppi
sweep_end_ray_index:
	data: <ndarray of type: int64 and shape: (10,)>
sweep_mode:
	data: <ndarray of type: |S1 and shape: (10, 32)>
sweep_number:
	data: <ndarray of type: int32 and shape: (10,)>
sweep_start_ray_index:
	data: <ndarray of type: int64 and shape: (10,)>
target_scan_rate: None
time:
	data: <ndarray of type: float64 and shape: (3600,)>
	_FillValue: nan
	standard_name: time
	long_name: time_in_seconds_since_volume_start
	units: seconds since 2022-04-02T13:31:09Z
	calendar: gregorian
metadata:
	instrument_name: Cherrapunji S-band Dual-pol DWR
	Created using: pyiwr (Python Indian Weather Radar Toolkit) Module developed by Researchers at SIGMA Research Lab, IIT Indore
	version: Version 1.0.0
	title: Cherrapunji S-band Dual-pol DWR data
	institution: ISRO
	references: Py-art_https://arm-doe.github.io/pyart/notebooks/basic_ingest_using_test_radar_object.html
	source: DWR volume scan data
	comment:
	Conventions: CF/Radial
	field_names: DBZ, VEL, WIDTH, ZDR, PHIDP, RHOHV
	history: DWR mosdac files (.nc) data encoded into Py-ART compatible NetCDF file
	volume_number: 0
	platform_type: fixed
	instrument_type: radar
	primary_axis: axis_z
Visualizations
For PPI at specific
elevation
= 'DBZ' , elevation_index= 0 , rings= True , grid= True ,= True , save_image= False , img_name= 'img.png' )
For PPI of any field at
all elevation
= 'DBZ' , rings= True , grid= True , range_in_km= True ,= False , img_name= 'img.png' )
For PPI of all fields
= 0 , range_in_km= True , rings= True , grid= True ,= False , img_name= 'img.png' )
For
gridded objects NC file from a radar object NetCDF files
File location
= pyiwr.format_transform.sweeps2gridnc (filename, grid_shape = (81 , 501 , 501 ) , height = 20 = 250 , save_file = False )
Processing file:  RSCHR_02APR2022_133109_L2B_STD.nc
Xarray gridding of volumetric sweeps of radar PPI scan file: RSCHR_02APR2022_133109_L2B_STD.nc done successfully
xarray.Dataset {
dimensions:
	time = 1 ;
	z = 81 ;
	y = 501 ;
	x = 501 ;

variables:
	object time(time) ;
	float64 z(z) ;
		z:standard_name = projection_z_coordinate ;
		z:long_name = Z distance on the projection plane from the origin ;
		z:axis = Z ;
		z:units = m ;
		z:positive = up ;
	float64 lat(y, x) ;
		lat:long_name = latitude of grid cell center ;
		lat:units = degree_N ;
		lat:standard_name = Latitude ;
	float64 lon(y, x) ;
		lon:long_name = longitude of grid cell center ;
		lon:units = degree_E ;
		lon:standard_name = Longitude ;
	float64 y(y) ;
		y:standard_name = projection_y_coordinate ;
		y:long_name = Y distance on the projection plane from the origin ;
		y:axis = Y ;
		y:units = m ;
	float64 x(x) ;
		x:standard_name = projection_x_coordinate ;
		x:long_name = X distance on the projection plane from the origin ;
		x:axis = X ;
		x:units = m ;
	float32 DBZ(time, z, y, x) ;
		DBZ:_FillValue = 0.0 ;
		DBZ:units = dBZ ;
		DBZ:standard_name = equivalent_reflectivity_factor ;
		DBZ:Polarization = Horizontal ;
		DBZ:coordinates = time range ;
	float32 VEL(time, z, y, x) ;
		VEL:_FillValue = 0.0 ;
		VEL:units = m/s ;
		VEL:standard_name = radial_velocity_of_scatterers_ away_from_instrument ;
		VEL:Polarization = Horizontal ;
		VEL:coordinates = time range ;
	float32 WIDTH(time, z, y, x) ;
		WIDTH:_FillValue = 0.0 ;
		WIDTH:units = m/s ;
		WIDTH:standard_name = doppler_spectrum_width ;
		WIDTH:Polarization = Horizontal ;
		WIDTH:coordinates = time range ;
	float32 ZDR(time, z, y, x) ;
		ZDR:_FillValue = 0.0 ;
		ZDR:units = dB ;
		ZDR:standard_name = log_differential_reflectivity_hv ;
		ZDR:Polarization = Horizontal and Vertical ;
		ZDR:coordinates = time range ;
	float32 PHIDP(time, z, y, x) ;
		PHIDP:_FillValue = 0.0 ;
		PHIDP:units = degrees ;
		PHIDP:standard_name = differential_phase_hv ;
		PHIDP:Polarization = Horizontal and Vertical ;
		PHIDP:coordinates = time range ;
	float32 RHOHV(time, z, y, x) ;
		RHOHV:_FillValue = 0.0 ;
		RHOHV:units =  ;
		RHOHV:standard_name = cross_correlation_ratio_hv ;
		RHOHV:Polarization = Horizontal and Vertical ;
		RHOHV:coordinates = time range ;
	float32 ROI(time, z, y, x) ;
		ROI:standard_name = radius_of_influence ;
		ROI:long_name = Radius of influence for mapping ;
		ROI:units = m ;
		ROI:least_significant_digit = 1 ;
		ROI:_FillValue = -9999.0 ;

// global attributes:
	:instrument_name = Cherrapunji S-band Dual-pol DWR ;
	:Created using = pyiwr (Python Indian Weather Radar Toolkit) Module developed by Researchers at SIGMA Research Lab, IIT Indore ;
	:version = Version 1.0.0 ;
	:title = Cherrapunji S-band Dual-pol DWR data ;
	:institution = ISRO ;
	:references = Py-art_https://arm-doe.github.io/pyart/notebooks/basic_ingest_using_test_radar_object.html ;
	:source = DWR volume scan data ;
	:comment =  ;
	:Conventions = CF/Radial ;
	:field_names = DBZ, VEL, WIDTH, ZDR, PHIDP, RHOHV ;
	:history = DWR mosdac files (.nc) data encoded into Py-ART compatible NetCDF file ;
	:volume_number = 0 ;
	:platform_type = fixed ;
	:instrument_type = radar ;
	:primary_axis = axis_z ;
}
For CAPPI in cartesian plane.
= 3 , field_name = 'DBZ' , radar_location = 'CHERRAPUNJI' ,= True , rings = False , ticks_in_km = True , save_image = False , img_name = 'img.png' )
For MAX CAPPI in cartesian
plane
= 'DBZ' , radar_location = 'CHERRAPUNJI' ,= True , rings = False , ticks_in_km = True , save_image = False , img_name = 'img.png' )
For
MAX CAPPI (with marginal cross-sections) in cartesian plane
= 'DBZ' , radar_location = 'CHERRAPUNJI' , rings= True , grid = True , cross_sections = True , save_image = False , img_name = 'img.png' )
For MAX
CAPPI (with marginal cross-sections) with map
= 'CHERRAPUNJI' , field_name = 'DBZ' ,= 'terrain-background' , cross_sections = False , save_image = False , img_name = 'img.png' )
Thank You